
Wettest counties in Wisconsin
Rain, sleet, snow, hail, wintry mix. Precipitation takes on many forms, and the degree to which climate change affects precipitation levels comes down to something almost everyone learns about in school—Earth's water cycle. A system in endless motion, the water cycle traces the process through which water exists in its three primary phases—liquid, solid, and gas—as it moves perpetually between the Earth and its atmosphere.
Increases in precipitation frequency and intensity are markers of climate change. When temperatures rise and oceans grow warmer, the amount of water that evaporates into the atmosphere—and the speed at which it does so—also increases. As atmospheric circulation carries the moisture-rich air over land or pushes it into a storm system, heavy rain or snow is often the result.
The continental U.S. on average received about 30 inches of precipitation between March 2022 and February 2023. Traditionally "wet" regions—such as Washington state and Alaska in the northwest and Georgia and Mississippi in the southeast—continue to have some of the rainiest counties in the United States. Other areas such as Oklahoma, Kansas, and Nebraska, as well as pockets of the South and of California, experience the opposite extreme: drought, also largely a product of climate change.
Stacker cited data from the National Centers for Environmental Information to identify the counties in Wisconsin that receive the most precipitation through rain, sleet, or snow. Counties are ranked by five-year precipitation averages in inches as of February 2023 with rainfall over the past year serving as a tiebreaker. Supplementary data on how last year's precipitation compares to the 100-year average for the area is also included.

#50. Sheboygan County
- Precipitation over the past year: 34.15 inches (#97 rainiest year since 1895)
- Precipitation compared to 1901-2000 average: 4.08 inches above norm

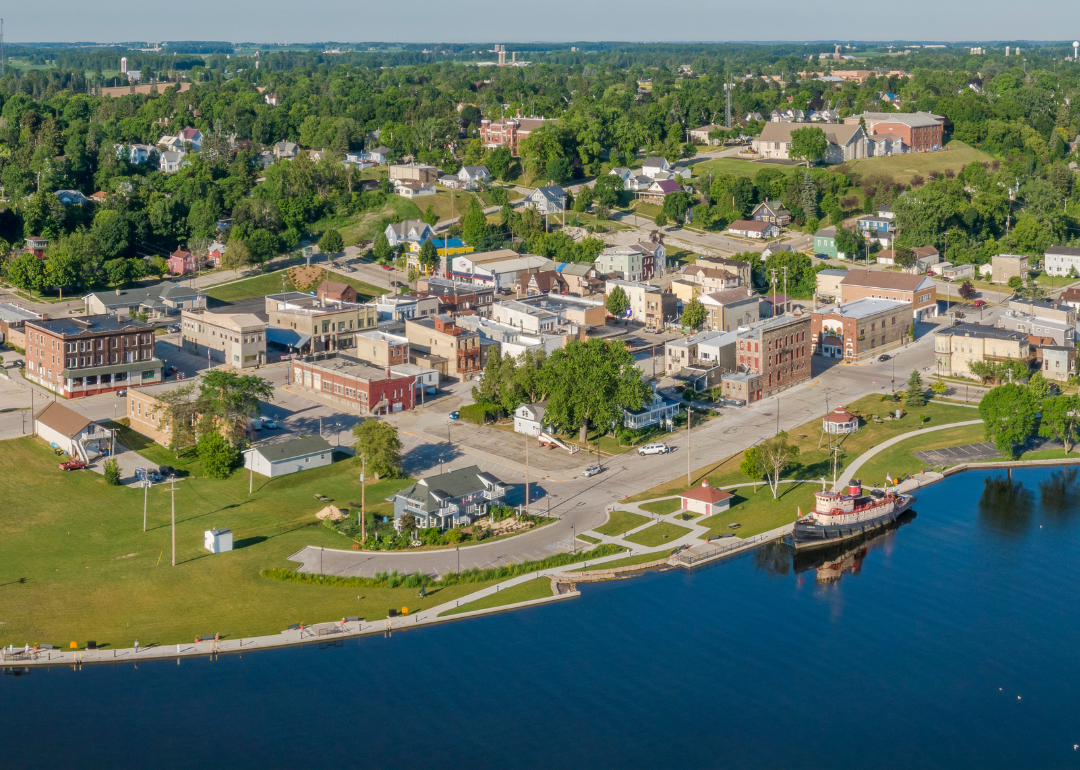
#49. Door County
- Precipitation over the past year: 35.78 inches (#117 rainiest year since 1895)
- Precipitation compared to 1901-2000 average: 6.06 inches above norm

#48. Iron County
- Precipitation over the past year: 37.41 inches (#105 rainiest year since 1895)
- Precipitation compared to 1901-2000 average: 4.37 inches above norm
#47. Oneida County
- Precipitation over the past year: 34.15 inches (#89 rainiest year since 1895)
- Precipitation compared to 1901-2000 average: 3.16 inches above norm

#46. Forest County
- Precipitation over the past year: 34.63 inches (#102 rainiest year since 1895)
- Precipitation compared to 1901-2000 average: 4.11 inches above norm
#45. Kewaunee County
- Precipitation over the past year: 36.06 inches (#118 rainiest year since 1895)
- Precipitation compared to 1901-2000 average: 6.24 inches above norm
#44. Washington County
- Precipitation over the past year: 39.33 inches (#125 rainiest year since 1895)
- Precipitation compared to 1901-2000 average: 8.39 inches above norm

#43. Langlade County
- Precipitation over the past year: 33.22 inches (#78 rainiest year since 1895)
- Precipitation compared to 1901-2000 average: 1.45 inches above norm
#42. Buffalo County
- Precipitation over the past year: 34.04 inches (#81 rainiest year since 1895)
- Precipitation compared to 1901-2000 average: 2.82 inches above norm

#41. Milwaukee County
- Precipitation over the past year: 38.51 inches (#120 rainiest year since 1895)
- Precipitation compared to 1901-2000 average: 7.61 inches above norm

#40. Waushara County
- Precipitation over the past year: 34.47 inches (#93 rainiest year since 1895)
- Precipitation compared to 1901-2000 average: 3.15 inches above norm

#39. Vilas County
- Precipitation over the past year: 37.30 inches (#107 rainiest year since 1895)
- Precipitation compared to 1901-2000 average: 5.51 inches above norm
#38. Wood County
- Precipitation over the past year: 34.85 inches (#93 rainiest year since 1895)
- Precipitation compared to 1901-2000 average: 3.55 inches above norm

#37. Marathon County
- Precipitation over the past year: 34.55 inches (#88 rainiest year since 1895)
- Precipitation compared to 1901-2000 average: 2.99 inches above norm

#36. Oconto County
- Precipitation over the past year: 36.40 inches (#120 rainiest year since 1895)
- Precipitation compared to 1901-2000 average: 6.51 inches above norm

#35. Jackson County
- Precipitation over the past year: 34.33 inches (#81 rainiest year since 1895)
- Precipitation compared to 1901-2000 average: 2.55 inches above norm

#34. Waukesha County
- Precipitation over the past year: 41.58 inches (#126 rainiest year since 1895)
- Precipitation compared to 1901-2000 average: 9.82 inches above norm

#33. Manitowoc County
- Precipitation over the past year: 35.52 inches (#111 rainiest year since 1895)
- Precipitation compared to 1901-2000 average: 5.56 inches above norm

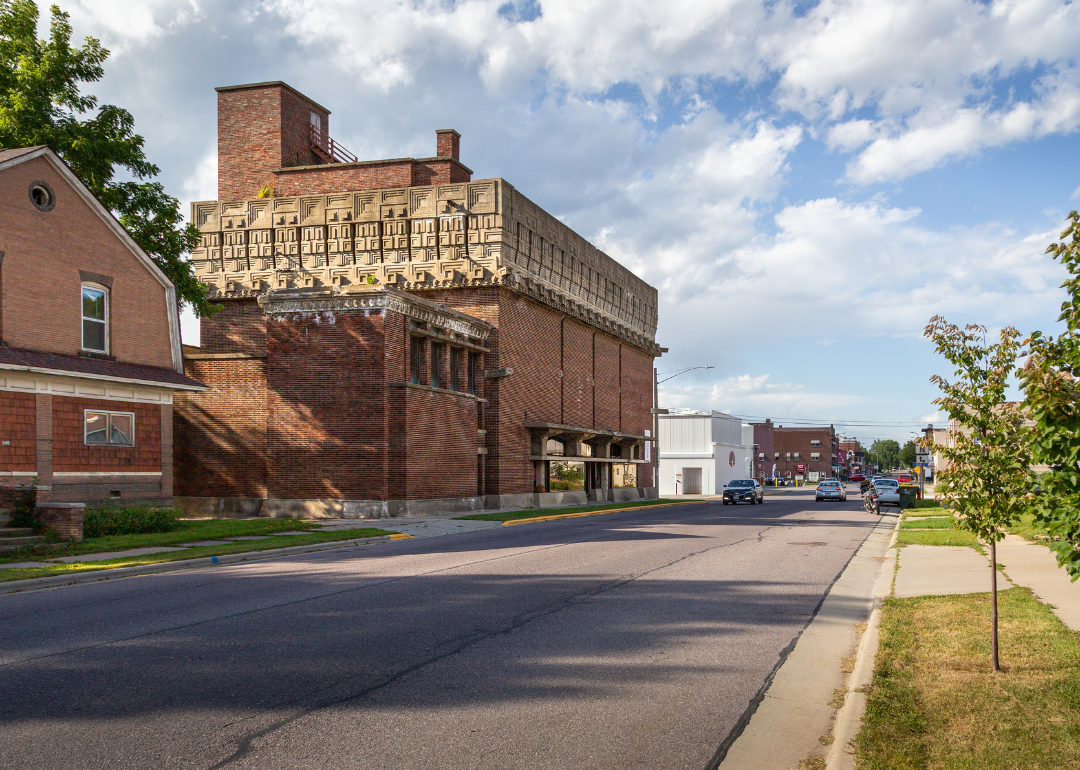
#32. Menominee County
- Precipitation over the past year: 34.27 inches (#90 rainiest year since 1895)
- Precipitation compared to 1901-2000 average: 3.25 inches above norm

#31. Waupaca County
- Precipitation over the past year: 37.03 inches (#114 rainiest year since 1895)
- Precipitation compared to 1901-2000 average: 6.09 inches above norm

#30. Portage County
- Precipitation over the past year: 35.99 inches (#101 rainiest year since 1895)
- Precipitation compared to 1901-2000 average: 4.47 inches above norm

#29. Shawano County
- Precipitation over the past year: 34.97 inches (#98 rainiest year since 1895)
- Precipitation compared to 1901-2000 average: 3.99 inches above norm
#28. Jefferson County
- Precipitation over the past year: 40.39 inches (#120 rainiest year since 1895)
- Precipitation compared to 1901-2000 average: 8.47 inches above norm

#27. Racine County
- Precipitation over the past year: 36.35 inches (#98 rainiest year since 1895)
- Precipitation compared to 1901-2000 average: 4.57 inches above norm

#26. Fond du Lac County
- Precipitation over the past year: 35.35 inches (#106 rainiest year since 1895)
- Precipitation compared to 1901-2000 average: 4.99 inches above norm
#25. Trempealeau County
- Precipitation over the past year: 35.79 inches (#93 rainiest year since 1895)
- Precipitation compared to 1901-2000 average: 4.13 inches above norm

#24. Kenosha County
- Precipitation over the past year: 36.04 inches (#93 rainiest year since 1895)
- Precipitation compared to 1901-2000 average: 3.88 inches above norm

#23. Brown County
- Precipitation over the past year: 37.57 inches (#124 rainiest year since 1895)
- Precipitation compared to 1901-2000 average: 7.70 inches above norm

#22. Dodge County
- Precipitation over the past year: 39.66 inches (#123 rainiest year since 1895)
- Precipitation compared to 1901-2000 average: 8.81 inches above norm
#21. Monroe County
- Precipitation over the past year: 37.50 inches (#103 rainiest year since 1895)
- Precipitation compared to 1901-2000 average: 5.36 inches above norm

#20. Marquette County
- Precipitation over the past year: 35.75 inches (#103 rainiest year since 1895)
- Precipitation compared to 1901-2000 average: 4.95 inches above norm

#19. Winnebago County
- Precipitation over the past year: 36.73 inches (#113 rainiest year since 1895)
- Precipitation compared to 1901-2000 average: 6.55 inches above norm

#18. Outagamie County
- Precipitation over the past year: 37.84 inches (#123 rainiest year since 1895)
- Precipitation compared to 1901-2000 average: 7.42 inches above norm

#17. Columbia County
- Precipitation over the past year: 37.98 inches (#116 rainiest year since 1895)
- Precipitation compared to 1901-2000 average: 6.88 inches above norm
#16. Richland County
- Precipitation over the past year: 36.22 inches (#86 rainiest year since 1895)
- Precipitation compared to 1901-2000 average: 3.95 inches above norm

#15. Adams County
- Precipitation over the past year: 36.04 inches (#101 rainiest year since 1895)
- Precipitation compared to 1901-2000 average: 4.55 inches above norm
#14. Green Lake County
- Precipitation over the past year: 36.73 inches (#114 rainiest year since 1895)
- Precipitation compared to 1901-2000 average: 5.93 inches above norm

#13. Calumet County
- Precipitation over the past year: 36.99 inches (#114 rainiest year since 1895)
- Precipitation compared to 1901-2000 average: 6.87 inches above norm

#12. Walworth County
- Precipitation over the past year: 38.79 inches (#101 rainiest year since 1895)
- Precipitation compared to 1901-2000 average: 5.51 inches above norm

#11. Rock County
- Precipitation over the past year: 40.44 inches (#110 rainiest year since 1895)
- Precipitation compared to 1901-2000 average: 7.47 inches above norm

#10. Iowa County
- Precipitation over the past year: 37.77 inches (#101 rainiest year since 1895)
- Precipitation compared to 1901-2000 average: 5.10 inches above norm

#9. Dane County
- Precipitation over the past year: 39.44 inches (#112 rainiest year since 1895)
- Precipitation compared to 1901-2000 average: 7.09 inches above norm

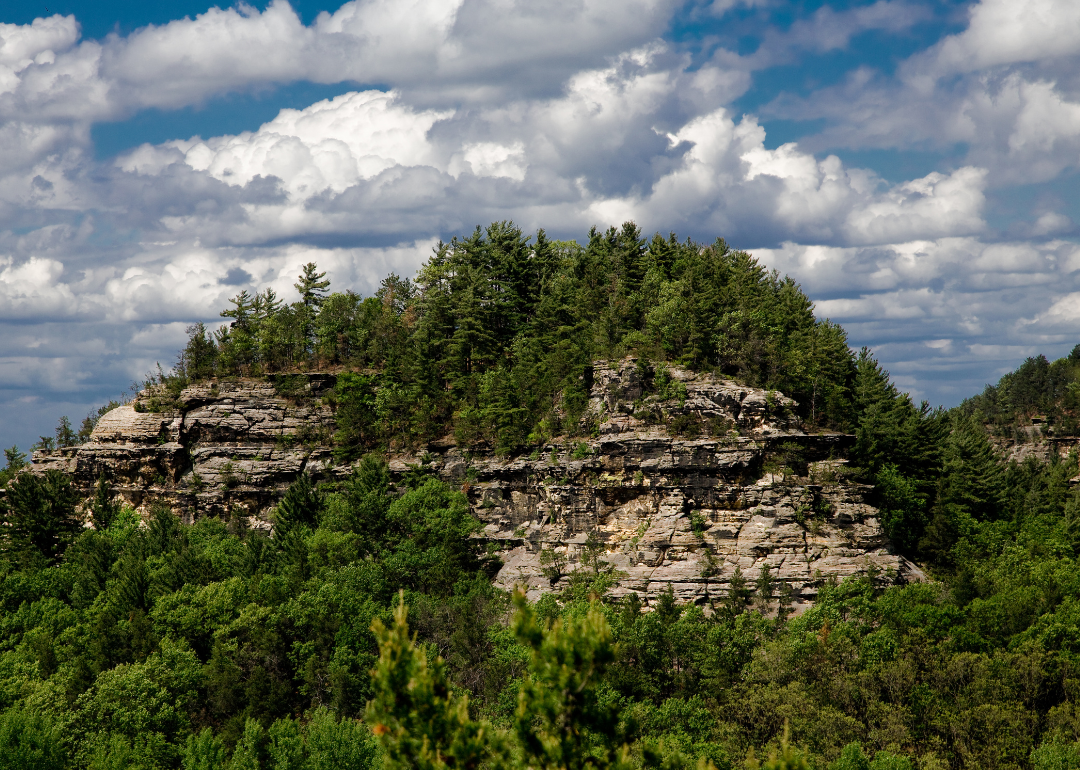
#8. Sauk County
- Precipitation over the past year: 36.94 inches (#101 rainiest year since 1895)
- Precipitation compared to 1901-2000 average: 4.99 inches above norm
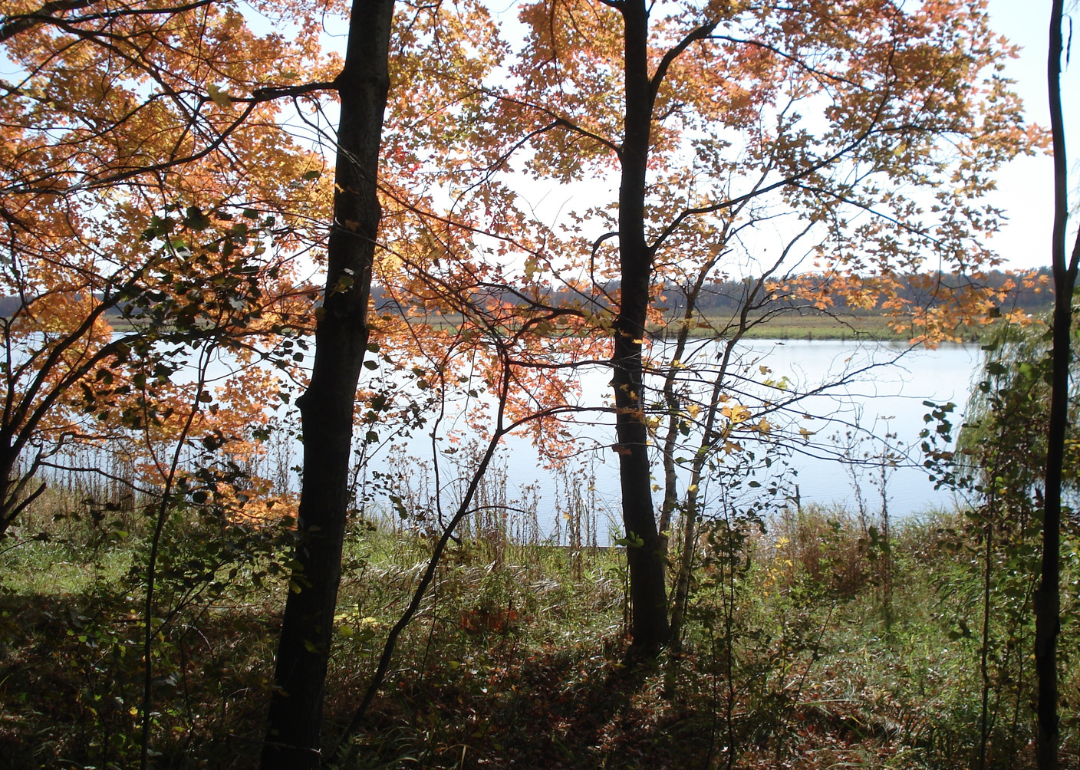
#7. Juneau County
- Precipitation over the past year: 38.23 inches (#114 rainiest year since 1895)
- Precipitation compared to 1901-2000 average: 6.57 inches above norm

#6. La Crosse County
- Precipitation over the past year: 36.49 inches (#99 rainiest year since 1895)
- Precipitation compared to 1901-2000 average: 4.73 inches above norm

#5. Vernon County
- Precipitation over the past year: 37.40 inches (#92 rainiest year since 1895)
- Precipitation compared to 1901-2000 average: 4.61 inches above norm

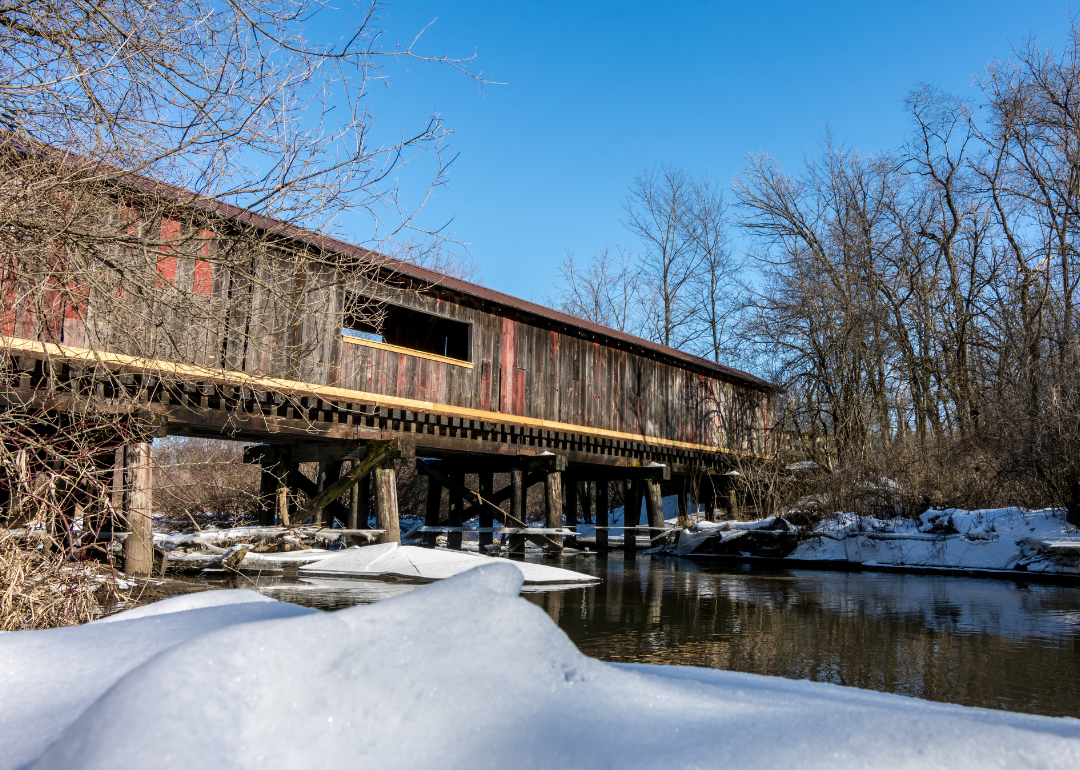
#4. Crawford County
- Precipitation over the past year: 37.50 inches (#101 rainiest year since 1895)
- Precipitation compared to 1901-2000 average: 4.74 inches above norm
#3. Green County
- Precipitation over the past year: 43.89 inches (#121 rainiest year since 1895)
- Precipitation compared to 1901-2000 average: 10.33 inches above norm

#2. Grant County
- Precipitation over the past year: 37.69 inches (#99 rainiest year since 1895)
- Precipitation compared to 1901-2000 average: 4.78 inches above norm
#1. Lafayette County
- Precipitation over the past year: 41.89 inches (#114 rainiest year since 1895)
- Precipitation compared to 1901-2000 average: 8.23 inches above norm


