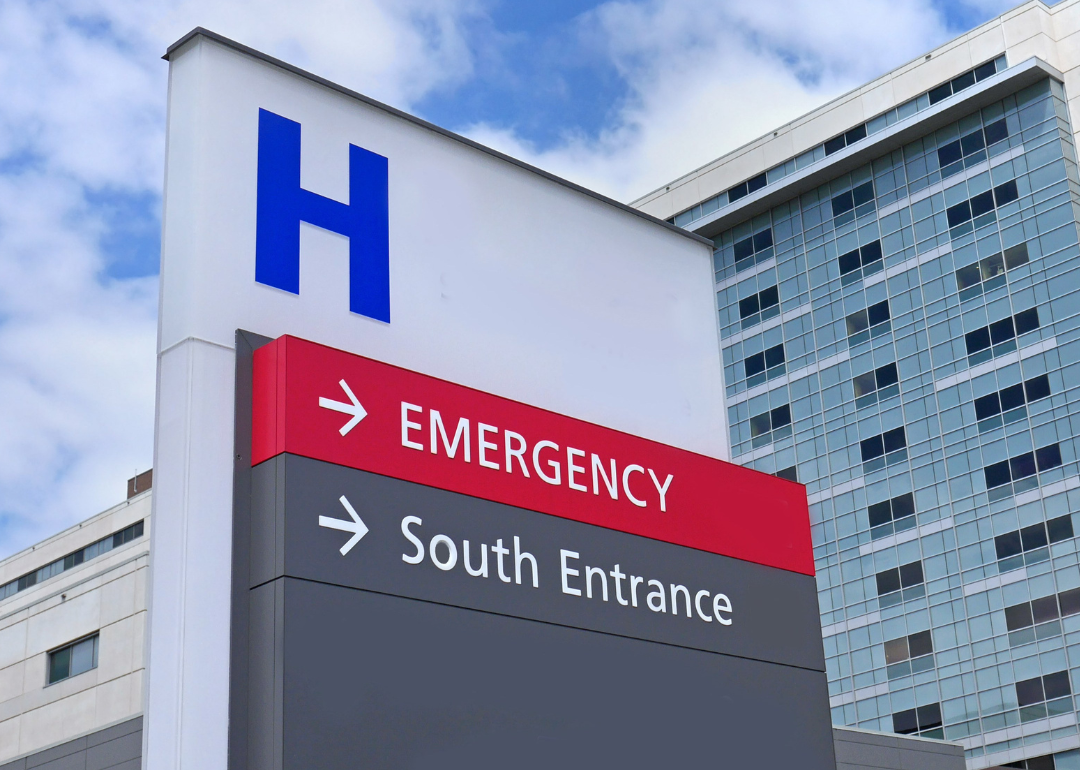
Counties with the lowest hospital bed capacity in Virginia
The vaccine deployment in December 2020 signaled a turning point in the COVID-19 pandemic. By the end of May 2021, 40% of the U.S. population was fully vaccinated. But as vaccination rates lagged over the summer, new surges of COVID-19 came, including Delta in the summer of 2021, and now the Omicron variant, which comprises the majority of cases in the U.S.
Researchers around the world have reported that Omicron is more transmissible than Delta, making breakthrough and repeat infections more likely. Early research suggests this strain may cause less severe illness than Delta and the original virus, however, health officials have warned an Omicron-driven surge could still increase hospitalization and death ratesâ€"especially in areas with less vaccinated populations.
The United States as of Feb. 24 reached 942,985 COVID-19-related deaths and nearly 78.7 million COVID-19 cases, according to Johns Hopkins University. Currently, 64.8% of the population is fully vaccinated, and 43.4% have received booster doses.
Stacker compiled a list of the counties with the lowest in-patient bed capacity in Virginia using data from the U.S. Department of Health & Human Services and vaccination data from Covid Act Now. Counties are ranked by the percent of in-patient hospital beds filled as of Feb. 23, with the percent of hospital beds filled by COVID-19 patients serving as a tiebreaker. Hospitalization data was available for about 77% of counties in the U.S. Keep reading to see what hospital capacity looks like in your county.
#50. Essex County, VA
--- 23.3% more availability than Virginia overall
- ICU beds occupied: 55.0% (2.0% by COVID-19 patients)
--- 23.6% more availability than Virginia overall
- Cases per 100k in last 7 days: 183 (20 cases)
- Population that is fully vaccinated: 61.7% (6,762 fully vaccinated)
--- -14.1% lower vaccination rate than Virginia
#49. Fauquier County, VA
--- 20.5% more availability than Virginia overall
- ICU beds occupied: 59.0% (7.0% by COVID-19 patients)
--- 18.1% more availability than Virginia overall
- Cases per 100k in last 7 days: 112 (80 cases)
- Population that is fully vaccinated: 74.0% (52,700 fully vaccinated)
--- 3.1% higher vaccination rate than Virginia
#48. New Kent County, VA
--- 20.5% more availability than Virginia overall
- ICU beds occupied: data not available
--- 72% full in Virginia overall
- Cases per 100k in last 7 days: 126 (29 cases)
- Population that is fully vaccinated: 65.5% (15,130 fully vaccinated)
--- -8.8% lower vaccination rate than Virginia
#47. Harrisonburg city, VA
--- 19.2% more availability than Virginia overall
- ICU beds occupied: 36.0% (6.0% by COVID-19 patients)
--- 50.0% more availability than Virginia overall
- Cases per 100k in last 7 days: 260 (138 cases)
- Population that is fully vaccinated: 55.1% (29,206 fully vaccinated)
--- -23.3% lower vaccination rate than Virginia
#46. Franklin city, VA
--- 15.1% more availability than Virginia overall
- ICU beds occupied: 35.0% (6.0% by COVID-19 patients)
--- 51.4% more availability than Virginia overall
- Cases per 100k in last 7 days: 138 (11 cases)
- Population that is fully vaccinated: not available
#45. James City County, VA
--- 15.1% more availability than Virginia overall
- ICU beds occupied: 43.0% (12.0% by COVID-19 patients)
--- 40.3% more availability than Virginia overall
- Cases per 100k in last 7 days: 251 (192 cases)
- Population that is fully vaccinated: 78.2% (59,828 fully vaccinated)
--- 8.9% higher vaccination rate than Virginia
#44. Winchester city, VA
--- 15.1% more availability than Virginia overall
- ICU beds occupied: 69.0% (14.0% by COVID-19 patients)
--- 4.2% more availability than Virginia overall
- Cases per 100k in last 7 days: 28 (8 cases)
- Population that is fully vaccinated: not available
#43. Manassas city, VA
--- 13.7% more availability than Virginia overall
- ICU beds occupied: 32.0% (2.0% by COVID-19 patients)
--- 55.6% more availability than Virginia overall
- Cases per 100k in last 7 days: 477 (196 cases)
- Population that is fully vaccinated: not available
#42. Montgomery County, VA
--- 13.7% more availability than Virginia overall
- ICU beds occupied: 98.0% (32.0% by COVID-19 patients)
--- 36.1% more full than Virginia overall
- Cases per 100k in last 7 days: 231 (228 cases)
- Population that is fully vaccinated: 56.1% (55,316 fully vaccinated)
--- -21.9% lower vaccination rate than Virginia
#41. Alexandria city, VA
--- 12.3% more availability than Virginia overall
- ICU beds occupied: 52.0% (4.0% by COVID-19 patients)
--- 27.8% more availability than Virginia overall
- Cases per 100k in last 7 days: 125 (200 cases)
- Population that is fully vaccinated: 76.2% (121,548 fully vaccinated)
--- 6.1% higher vaccination rate than Virginia
#40. Russell County, VA
--- 11.0% more availability than Virginia overall
- ICU beds occupied: 11.0% (9.0% by COVID-19 patients)
--- 84.7% more availability than Virginia overall
- Cases per 100k in last 7 days: 624 (166 cases)
- Population that is fully vaccinated: 49.9% (13,271 fully vaccinated)
--- -30.5% lower vaccination rate than Virginia
#39. Giles County, VA
--- 11.0% more availability than Virginia overall
- ICU beds occupied: 54.0% (25.0% by COVID-19 patients)
--- 25.0% more availability than Virginia overall
- Cases per 100k in last 7 days: 634 (106 cases)
- Population that is fully vaccinated: 54.9% (9,184 fully vaccinated)
--- -23.5% lower vaccination rate than Virginia
#38. Prince Edward County, VA
--- 8.2% more availability than Virginia overall
- ICU beds occupied: 73.0% (0.0% by COVID-19 patients)
--- 1.4% more full than Virginia overall
- Cases per 100k in last 7 days: 228 (52 cases)
- Population that is fully vaccinated: 46.1% (10,508 fully vaccinated)
--- -35.8% lower vaccination rate than Virginia
#37. Prince William County, VA
--- 6.8% more availability than Virginia overall
- ICU beds occupied: 83.0% (4.0% by COVID-19 patients)
--- 15.3% more full than Virginia overall
- Cases per 100k in last 7 days: 60 (281 cases)
- Population that is fully vaccinated: 76.1% (357,865 fully vaccinated)
--- 6.0% higher vaccination rate than Virginia
#36. Loudoun County, VA
--- 4.1% more availability than Virginia overall
- ICU beds occupied: 71.0% (15.0% by COVID-19 patients)
--- 1.4% more availability than Virginia overall
- Cases per 100k in last 7 days: 127 (526 cases)
- Population that is fully vaccinated: 76.7% (317,082 fully vaccinated)
--- 6.8% higher vaccination rate than Virginia
#35. Henrico County, VA
--- 4.1% more availability than Virginia overall
- ICU beds occupied: 73.0% (12.0% by COVID-19 patients)
--- 1.4% more full than Virginia overall
- Cases per 100k in last 7 days: 179 (592 cases)
- Population that is fully vaccinated: 70.7% (233,763 fully vaccinated)
--- -1.5% lower vaccination rate than Virginia
#34. Portsmouth city, VA
--- 2.7% more availability than Virginia overall
- ICU beds occupied: 47.0% (8.0% by COVID-19 patients)
--- 34.7% more availability than Virginia overall
- Cases per 100k in last 7 days: 126 (119 cases)
- Population that is fully vaccinated: 63.0% (59,498 fully vaccinated)
--- -12.3% lower vaccination rate than Virginia
#33. Petersburg city, VA
--- 1.4% more availability than Virginia overall
- ICU beds occupied: 92.0% (26.0% by COVID-19 patients)
--- 27.8% more full than Virginia overall
- Cases per 100k in last 7 days: 278 (87 cases)
- Population that is fully vaccinated: 57.8% (18,125 fully vaccinated)
--- -19.5% lower vaccination rate than Virginia
#32. Lynchburg city, VA
--- 0.0% more availability than Virginia overall
- ICU beds occupied: 90.0% (15.0% by COVID-19 patients)
--- 25.0% more full than Virginia overall
- Cases per 100k in last 7 days: 411 (338 cases)
- Population that is fully vaccinated: 46.6% (38,250 fully vaccinated)
--- -35.1% lower vaccination rate than Virginia
#31. Albemarle County, VA
--- 1.4% more full than Virginia overall
- ICU beds occupied: 43.0% (5.0% by COVID-19 patients)
--- 40.3% more availability than Virginia overall
- Cases per 100k in last 7 days: 403 (441 cases)
- Population that is fully vaccinated: 80.3% (87,744 fully vaccinated)
--- 11.8% higher vaccination rate than Virginia
#30. Hopewell city, VA
--- 2.7% more full than Virginia overall
- ICU beds occupied: 87.0% (35.0% by COVID-19 patients)
--- 20.8% more full than Virginia overall
- Cases per 100k in last 7 days: 213 (48 cases)
- Population that is fully vaccinated: 53.3% (12,002 fully vaccinated)
--- -25.8% lower vaccination rate than Virginia
#29. Roanoke city, VA
--- 2.7% more full than Virginia overall
- ICU beds occupied: 88.0% (31.0% by COVID-19 patients)
--- 22.2% more full than Virginia overall
- Cases per 100k in last 7 days: 156 (155 cases)
- Population that is fully vaccinated: 59.4% (58,863 fully vaccinated)
--- -17.3% lower vaccination rate than Virginia
#28. Danville city, VA
--- 2.7% more full than Virginia overall
- ICU beds occupied: 103.0% (28.0% by COVID-19 patients)
--- 43.1% more full than Virginia overall
- Cases per 100k in last 7 days: 195 (78 cases)
- Population that is fully vaccinated: 53.2% (21,286 fully vaccinated)
--- -25.9% lower vaccination rate than Virginia
#27. Bedford County, VA
--- 4.1% more full than Virginia overall
- ICU beds occupied: 74.0% (0.0% by COVID-19 patients)
--- 2.8% more full than Virginia overall
- Cases per 100k in last 7 days: 367 (290 cases)
- Population that is fully vaccinated: 54.2% (42,812 fully vaccinated)
--- -24.5% lower vaccination rate than Virginia
#26. Fairfax County, VA
--- 4.1% more full than Virginia overall
- ICU beds occupied: 82.0% (7.0% by COVID-19 patients)
--- 13.9% more full than Virginia overall
- Cases per 100k in last 7 days: 80 (918 cases)
- Population that is fully vaccinated: 79.7% (914,706 fully vaccinated)
--- 11.0% higher vaccination rate than Virginia
#25. Arlington County, VA
--- 5.5% more full than Virginia overall
- ICU beds occupied: 67.0% (11.0% by COVID-19 patients)
--- 6.9% more availability than Virginia overall
- Cases per 100k in last 7 days: 201 (477 cases)
- Population that is fully vaccinated: 86.6% (205,156 fully vaccinated)
--- 20.6% higher vaccination rate than Virginia
#24. Salem city, VA
--- 5.5% more full than Virginia overall
- ICU beds occupied: 88.0% (31.0% by COVID-19 patients)
--- 22.2% more full than Virginia overall
- Cases per 100k in last 7 days: 277 (70 cases)
- Population that is fully vaccinated: 73.7% (18,637 fully vaccinated)
--- 2.6% higher vaccination rate than Virginia
#23. Norfolk city, VA
--- 6.8% more full than Virginia overall
- ICU beds occupied: 57.0% (8.0% by COVID-19 patients)
--- 20.8% more availability than Virginia overall
- Cases per 100k in last 7 days: 88 (213 cases)
- Population that is fully vaccinated: 95.0% (235,462 fully vaccinated)
--- 32.3% higher vaccination rate than Virginia
#22. Charlottesville city, VA
--- 8.2% more full than Virginia overall
- ICU beds occupied: 63.0% (16.0% by COVID-19 patients)
--- 12.5% more availability than Virginia overall
- Cases per 100k in last 7 days: 317 (150 cases)
- Population that is fully vaccinated: 67.9% (32,075 fully vaccinated)
--- -5.4% lower vaccination rate than Virginia
#21. Wythe County, VA
--- 8.2% more full than Virginia overall
- ICU beds occupied: 63.0% (41.0% by COVID-19 patients)
--- 12.5% more availability than Virginia overall
- Cases per 100k in last 7 days: 439 (126 cases)
- Population that is fully vaccinated: 45.7% (13,096 fully vaccinated)
--- -36.4% lower vaccination rate than Virginia
#20. Newport News city, VA
--- 8.2% more full than Virginia overall
- ICU beds occupied: 71.0% (11.0% by COVID-19 patients)
--- 1.4% more availability than Virginia overall
- Cases per 100k in last 7 days: 95 (170 cases)
- Population that is fully vaccinated: 66.5% (119,178 fully vaccinated)
--- -7.4% lower vaccination rate than Virginia
#19. Virginia Beach city, VA
--- 9.6% more full than Virginia overall
- ICU beds occupied: 38.0% (7.0% by COVID-19 patients)
--- 47.2% more availability than Virginia overall
- Cases per 100k in last 7 days: 104 (466 cases)
- Population that is fully vaccinated: 76.7% (345,289 fully vaccinated)
--- 6.8% higher vaccination rate than Virginia
#18. Chesterfield County, VA
--- 9.6% more full than Virginia overall
- ICU beds occupied: 78.0% (12.0% by COVID-19 patients)
--- 8.3% more full than Virginia overall
- Cases per 100k in last 7 days: 134 (473 cases)
- Population that is fully vaccinated: 69.6% (245,530 fully vaccinated)
--- -3.1% lower vaccination rate than Virginia
#17. Augusta County, VA
--- 9.6% more full than Virginia overall
- ICU beds occupied: 86.0% (23.0% by COVID-19 patients)
--- 19.4% more full than Virginia overall
- Cases per 100k in last 7 days: 311 (235 cases)
- Population that is fully vaccinated: 58.8% (44,404 fully vaccinated)
--- -18.1% lower vaccination rate than Virginia
#16. Spotsylvania County, VA
--- 11.0% more full than Virginia overall
- ICU beds occupied: 56.0% (21.0% by COVID-19 patients)
--- 22.2% more availability than Virginia overall
- Cases per 100k in last 7 days: 155 (211 cases)
- Population that is fully vaccinated: 58.8% (80,147 fully vaccinated)
--- -18.1% lower vaccination rate than Virginia
#15. Lexington city, VA
--- 12.3% more full than Virginia overall
- ICU beds occupied: 69.0% (26.0% by COVID-19 patients)
--- 4.2% more availability than Virginia overall
- Cases per 100k in last 7 days: 443 (33 cases)
- Population that is fully vaccinated: 57.1% (4,248 fully vaccinated)
--- -20.5% lower vaccination rate than Virginia
#14. Richmond city, VA
--- 13.7% more full than Virginia overall
- ICU beds occupied: 93.0% (33.0% by COVID-19 patients)
--- 29.2% more full than Virginia overall
- Cases per 100k in last 7 days: 158 (363 cases)
- Population that is fully vaccinated: 58.1% (133,837 fully vaccinated)
--- -19.1% lower vaccination rate than Virginia
#13. Page County, VA
--- 16.4% more full than Virginia overall
- ICU beds occupied: data not available
--- 72% full in Virginia overall
- Cases per 100k in last 7 days: 213 (51 cases)
- Population that is fully vaccinated: 49.4% (11,804 fully vaccinated)
--- -31.2% lower vaccination rate than Virginia
#12. Chesapeake city, VA
--- 17.8% more full than Virginia overall
- ICU beds occupied: 79.0% (16.0% by COVID-19 patients)
--- 9.7% more full than Virginia overall
- Cases per 100k in last 7 days: 152 (373 cases)
- Population that is fully vaccinated: 76.0% (186,086 fully vaccinated)
--- 5.8% higher vaccination rate than Virginia
#11. Mecklenburg County, VA
--- 19.2% more full than Virginia overall
- ICU beds occupied: 76.0% (19.0% by COVID-19 patients)
--- 5.6% more full than Virginia overall
- Cases per 100k in last 7 days: 248 (76 cases)
- Population that is fully vaccinated: 56.0% (17,137 fully vaccinated)
--- -22.0% lower vaccination rate than Virginia
#10. Buchanan County, VA
--- 20.5% more full than Virginia overall
- ICU beds occupied: 94.0% (57.0% by COVID-19 patients)
--- 30.6% more full than Virginia overall
- Cases per 100k in last 7 days: 747 (157 cases)
- Population that is fully vaccinated: 48.9% (10,274 fully vaccinated)
--- -31.9% lower vaccination rate than Virginia
#9. Shenandoah County, VA
--- 20.5% more full than Virginia overall
- ICU beds occupied: data not available
--- 72% full in Virginia overall
- Cases per 100k in last 7 days: 289 (126 cases)
- Population that is fully vaccinated: 56.0% (24,425 fully vaccinated)
--- -22.0% lower vaccination rate than Virginia
#8. Warren County, VA
--- 21.9% more full than Virginia overall
- ICU beds occupied: data not available
--- 72% full in Virginia overall
- Cases per 100k in last 7 days: 167 (67 cases)
- Population that is fully vaccinated: 51.1% (20,527 fully vaccinated)
--- -28.8% lower vaccination rate than Virginia
#7. Suffolk city, VA
--- 23.3% more full than Virginia overall
- ICU beds occupied: 69.0% (12.0% by COVID-19 patients)
--- 4.2% more availability than Virginia overall
- Cases per 100k in last 7 days: 111 (102 cases)
- Population that is fully vaccinated: 62.7% (57,797 fully vaccinated)
--- -12.7% lower vaccination rate than Virginia
#6. Washington County, VA
--- 23.3% more full than Virginia overall
- ICU beds occupied: 71.0% (29.0% by COVID-19 patients)
--- 1.4% more availability than Virginia overall
- Cases per 100k in last 7 days: 448 (241 cases)
- Population that is fully vaccinated: 54.0% (28,995 fully vaccinated)
--- -24.8% lower vaccination rate than Virginia
#5. Franklin County, VA
--- 27.4% more full than Virginia overall
- ICU beds occupied: 71.0% (11.0% by COVID-19 patients)
--- 1.4% more availability than Virginia overall
- Cases per 100k in last 7 days: 355 (199 cases)
- Population that is fully vaccinated: 50.1% (28,056 fully vaccinated)
--- -30.2% lower vaccination rate than Virginia
#4. Hanover County, VA
--- 32.9% more full than Virginia overall
- ICU beds occupied: 71.0% (18.0% by COVID-19 patients)
--- 1.4% more availability than Virginia overall
- Cases per 100k in last 7 days: 173 (186 cases)
- Population that is fully vaccinated: 72.0% (77,558 fully vaccinated)
--- 0.3% higher vaccination rate than Virginia
#3. Stafford County, VA
--- 37.0% more full than Virginia overall
- ICU beds occupied: 100.0% (5.0% by COVID-19 patients)
--- 38.9% more full than Virginia overall
- Cases per 100k in last 7 days: 199 (304 cases)
- Population that is fully vaccinated: 64.0% (97,880 fully vaccinated)
--- -10.9% lower vaccination rate than Virginia
#2. Fredericksburg city, VA
--- 37.0% more full than Virginia overall
- ICU beds occupied: 100.0% (30.0% by COVID-19 patients)
--- 38.9% more full than Virginia overall
- Cases per 100k in last 7 days: 117 (34 cases)
- Population that is fully vaccinated: 56.8% (16,494 fully vaccinated)
--- -20.9% lower vaccination rate than Virginia
#1. Smyth County, VA
--- 53.4% more full than Virginia overall
- ICU beds occupied: 80.0% (70.0% by COVID-19 patients)
--- 11.1% more full than Virginia overall
- Cases per 100k in last 7 days: 957 (288 cases)
- Population that is fully vaccinated: 52.1% (15,693 fully vaccinated)
--- -27.4% lower vaccination rate than Virginia


