
Counties with the highest rates of strokes in Virginia
Counties with the highest rates of strokes in Virginia
For more than a century, strokes have been a leading cause of death among U.S. adults, according to the Centers for Disease Control and Prevention. The sudden cerebrovascular event affects nearly 800,000 Americans annually and is also a leading cause of disability.
The tragedy of the nation's stroke rate is amplified by its preventability. Four out of five strokes are preventable, according to the CDC.
Stacker used CDC data to list the counties in Virginia with the highest prevalence of stroke. Data is based on estimates compiled by the CDC, with the confidence range included for each county. Additional data on death rates between 2018 and 2020 for the two most common types of strokes, ischemic and hemorrhagic, are also included for each county. In cases of a tie, the ischemic and hemorrhagic stroke death rates are used as tiebreakers.
An ischemic stroke occurs when a blood clot blocks an artery leading to the brain. These account for 87% of strokes in the U.S. In hemorrhagic strokes, a ruptured blood vessel causes active bleeding in the brain. These kinds of strokes are often more serious.
When someone suffers a stroke, a swift medical response can have a major impact on their recovery. Early treatment by doctors can help dissolve the clot in ischemic strokes and limit the expansion of the brain bleed in hemorrhagic strokes. Knowing the signs—including drooping on one side of the face, inability to lift one arm or leg, and slurred speech—and calling 911 immediately can help save lives.
Research shows that the first one to three months after a stroke are the most crucial for retraining the brain to complete tasks that once felt second nature, with emerging research suggesting progress does not halt after six months. Ongoing therapy has an impact on stroke victims throughout their recovery journey, even if progress slows. Despite these promising findings, many health insurance plans limit how much therapy is covered and make regular, long-term treatment more challenging for survivors of strokes and their families.
The rate of strokes is most prominent throughout the Southeast; public health experts have termed the region the "stroke belt" for its higher death rates than the national average. Racial disparities are also prominent, with Black people experiencing and dying from strokes at higher rates, according to the Office of Minority Health.
Preventative care is critical for lowering stroke risk, even for people who otherwise feel healthy.
Annual check-ins with a physician can help track risk factors including high cholesterol, diabetes, and obesity. Hypertension, or high blood pressure, is the leading cause of stroke, and it can be caused by overconsumption of salty foods, drinking alcohol, smoking, stress, and genetics. High blood pressure has less obvious symptoms, but people can regularly track their metrics using at-home blood pressure cuffs to know if they need to talk to their doctor sooner than scheduled. The American Heart Association has recommendations for which readings require medical intervention.
Read on to see which counties had the highest rates of strokes in Virginia.

#50. Suffolk
- Death rate for ischemic strokes, 2018-20: 22.8 per 100K people
- Death rate for hemorrhagic strokes, 2018-20: 9.6 per 100K people

#49. King and Queen County
- Death rate for ischemic strokes, 2018-20: 19.5 per 100K people
- Death rate for hemorrhagic strokes, 2018-20: 8.9 per 100K people
#48. Tazewell County
- Death rate for ischemic strokes, 2018-20: 22.4 per 100K people
- Death rate for hemorrhagic strokes, 2018-20: 8.3 per 100K people

#47. Southampton County
- Death rate for ischemic strokes, 2018-20: 23.2 per 100K people
- Death rate for hemorrhagic strokes, 2018-20: 9.1 per 100K people

#46. Scott County
- Death rate for ischemic strokes, 2018-20: 23.6 per 100K people
- Death rate for hemorrhagic strokes, 2018-20: 10.6 per 100K people
You may also like: Highest-rated specialty museums in Virginia, according to Tripadvisor

#45. Prince George County
- Death rate for ischemic strokes, 2018-20: 24.4 per 100K people
- Death rate for hemorrhagic strokes, 2018-20: 10.1 per 100K people

#44. Bristol
- Death rate for ischemic strokes, 2018-20: 25.4 per 100K people
- Death rate for hemorrhagic strokes, 2018-20: 11.9 per 100K people

#43. Dinwiddie County
- Death rate for ischemic strokes, 2018-20: 25.9 per 100K people
- Death rate for hemorrhagic strokes, 2018-20: 9.5 per 100K people
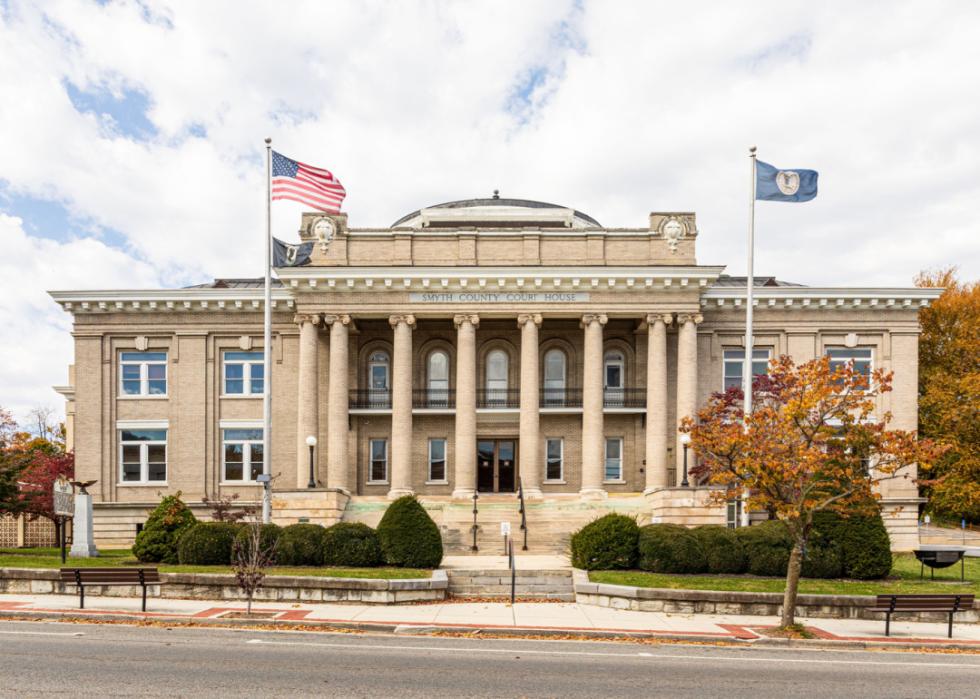
#42. Smyth County
- Death rate for ischemic strokes, 2018-20: 21.1 per 100K people
- Death rate for hemorrhagic strokes, 2018-20: 9.9 per 100K people
#41. Amelia County
- Death rate for ischemic strokes, 2018-20: 21.4 per 100K people
- Death rate for hemorrhagic strokes, 2018-20: 10.2 per 100K people
You may also like: Most popular baby names for boys of the last decade in Virginia

#40. Grayson County
- Death rate for ischemic strokes, 2018-20: 22.1 per 100K people
- Death rate for hemorrhagic strokes, 2018-20: 10.4 per 100K people
#39. Russell County
- Death rate for ischemic strokes, 2018-20: 23.5 per 100K people
- Death rate for hemorrhagic strokes, 2018-20: 10.2 per 100K people
#38. Northampton County
- Death rate for ischemic strokes, 2018-20: 26.0 per 100K people
- Death rate for hemorrhagic strokes, 2018-20: 14.9 per 100K people
#37. Bath County
- Death rate for ischemic strokes, 2018-20: 20.3 per 100K people
- Death rate for hemorrhagic strokes, 2018-20: 8.9 per 100K people

#36. Newport News
- Death rate for ischemic strokes, 2018-20: 23.4 per 100K people
- Death rate for hemorrhagic strokes, 2018-20: 9.2 per 100K people
You may also like: Counties with the worst commutes in Virginia

#35. Pittsylvania County
- Death rate for ischemic strokes, 2018-20: 23.8 per 100K people
- Death rate for hemorrhagic strokes, 2018-20: 10.8 per 100K people

#34. Covington
- Death rate for ischemic strokes, 2018-20: 26.0 per 100K people
- Death rate for hemorrhagic strokes, 2018-20: 11.3 per 100K people
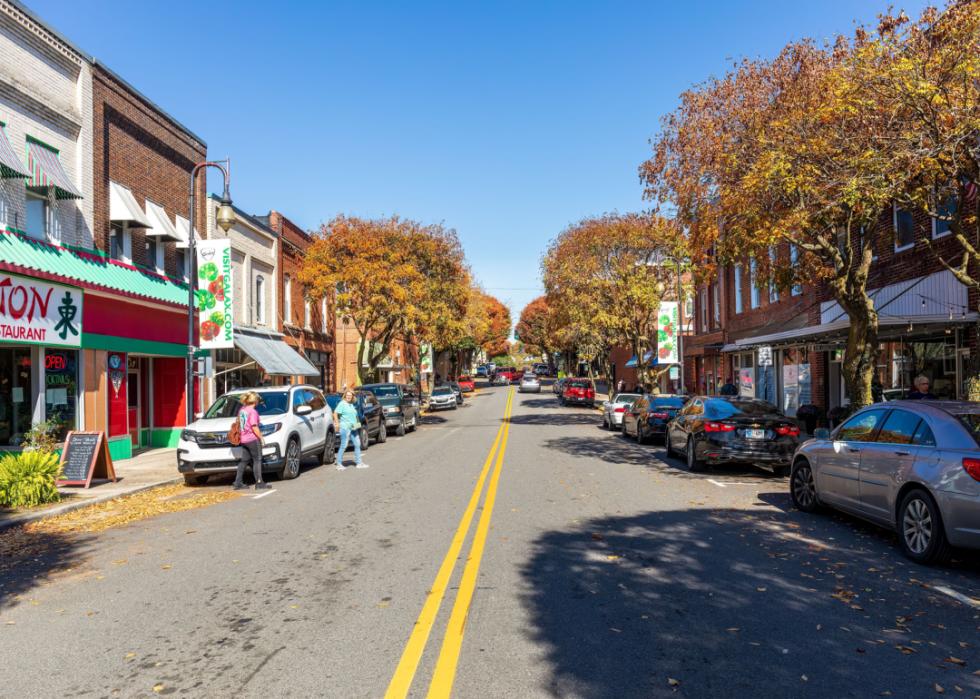
#33. Galax
- Death rate for ischemic strokes, 2018-20: 27.3 per 100K people
- Death rate for hemorrhagic strokes, 2018-20: 12.2 per 100K people

#32. Wise County
- Death rate for ischemic strokes, 2018-20: 27.7 per 100K people
- Death rate for hemorrhagic strokes, 2018-20: 7.7 per 100K people

#31. Norton
- Death rate for ischemic strokes, 2018-20: 29.7 per 100K people
- Death rate for hemorrhagic strokes, 2018-20: 14.6 per 100K people
You may also like: Most popular baby names for girls in Virginia
#30. Hampton
- Death rate for ischemic strokes, 2018-20: 22.2 per 100K people
- Death rate for hemorrhagic strokes, 2018-20: 9.5 per 100K people

#29. Buena Vista
- Death rate for ischemic strokes, 2018-20: 23.7 per 100K people
- Death rate for hemorrhagic strokes, 2018-20: 9.1 per 100K people

#28. Accomack County
- Death rate for ischemic strokes, 2018-20: 23.8 per 100K people
- Death rate for hemorrhagic strokes, 2018-20: 11.4 per 100K people

#27. Westmoreland County
- Death rate for ischemic strokes, 2018-20: 24.6 per 100K people
- Death rate for hemorrhagic strokes, 2018-20: 7.1 per 100K people
#26. Radford
- Death rate for ischemic strokes, 2018-20: 24.8 per 100K people
- Death rate for hemorrhagic strokes, 2018-20: 9.5 per 100K people
You may also like: What to know about workers' compensation in Virginia

#25. Mecklenburg County
- Death rate for ischemic strokes, 2018-20: 27.7 per 100K people
- Death rate for hemorrhagic strokes, 2018-20: 11.3 per 100K people

#24. Henry County
- Death rate for ischemic strokes, 2018-20: 22.5 per 100K people
- Death rate for hemorrhagic strokes, 2018-20: 9.6 per 100K people

#23. Surry County
- Death rate for ischemic strokes, 2018-20: 23.2 per 100K people
- Death rate for hemorrhagic strokes, 2018-20: 8.8 per 100K people

#22. Richmond County
- Death rate for ischemic strokes, 2018-20: 24.6 per 100K people
- Death rate for hemorrhagic strokes, 2018-20: 7.5 per 100K people
#21. Dickenson County
- Death rate for ischemic strokes, 2018-20: 25.7 per 100K people
- Death rate for hemorrhagic strokes, 2018-20: 8.9 per 100K people
You may also like: Virginia's climate has warmed by 1.58° F since 1970

#20. Charlotte County
- Death rate for ischemic strokes, 2018-20: 27.5 per 100K people
- Death rate for hemorrhagic strokes, 2018-20: 12.0 per 100K people

#19. Lee County
- Death rate for ischemic strokes, 2018-20: 28.1 per 100K people
- Death rate for hemorrhagic strokes, 2018-20: 9.6 per 100K people
#18. Prince Edward County
- Death rate for ischemic strokes, 2018-20: 22.7 per 100K people
- Death rate for hemorrhagic strokes, 2018-20: 11.0 per 100K people

#17. Essex County
- Death rate for ischemic strokes, 2018-20: 23.1 per 100K people
- Death rate for hemorrhagic strokes, 2018-20: 9.0 per 100K people
#16. Portsmouth
- Death rate for ischemic strokes, 2018-20: 23.8 per 100K people
- Death rate for hemorrhagic strokes, 2018-20: 10.7 per 100K people
You may also like: Counties with highest COVID-19 infection rates in Virginia

#15. Buchanan County
- Death rate for ischemic strokes, 2018-20: 25.5 per 100K people
- Death rate for hemorrhagic strokes, 2018-20: 10.1 per 100K people

#14. Halifax County
- Death rate for ischemic strokes, 2018-20: 30.3 per 100K people
- Death rate for hemorrhagic strokes, 2018-20: 10.9 per 100K people

#13. Buckingham County
- Death rate for ischemic strokes, 2018-20: 20.6 per 100K people
- Death rate for hemorrhagic strokes, 2018-20: 8.7 per 100K people

#12. Nottoway County
- Death rate for ischemic strokes, 2018-20: 23.0 per 100K people
- Death rate for hemorrhagic strokes, 2018-20: 8.8 per 100K people
#11. Charles City County
- Death rate for ischemic strokes, 2018-20: 23.2 per 100K people
- Death rate for hemorrhagic strokes, 2018-20: 9.3 per 100K people
You may also like: Best public high schools in Virginia

#10. Lunenburg County
- Death rate for ischemic strokes, 2018-20: 25.6 per 100K people
- Death rate for hemorrhagic strokes, 2018-20: 10.4 per 100K people
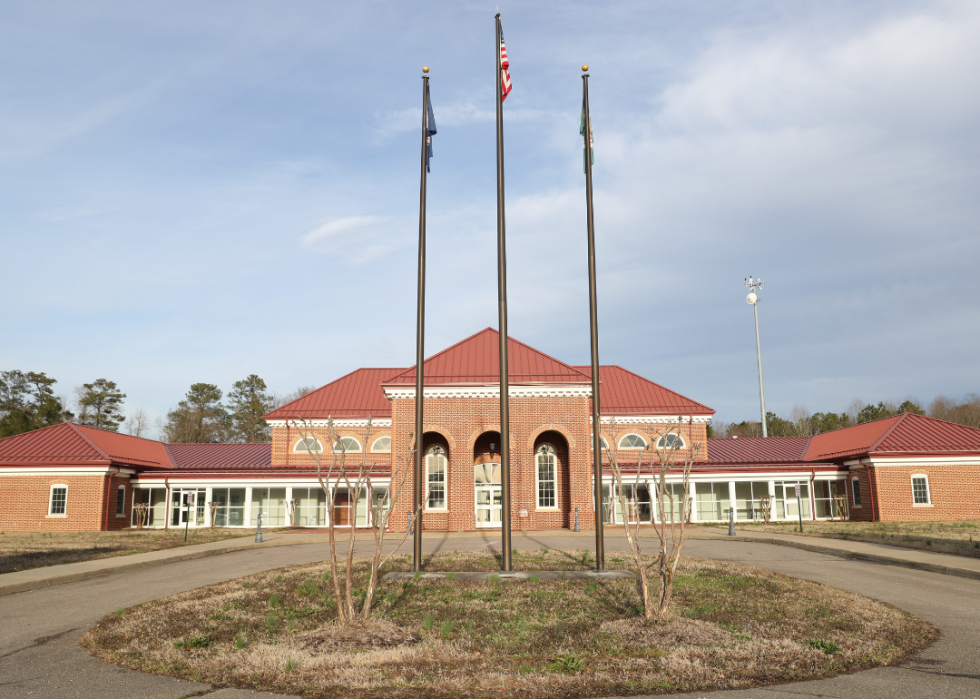
#9. Sussex County
- Death rate for ischemic strokes, 2018-20: 27.7 per 100K people
- Death rate for hemorrhagic strokes, 2018-20: 7.8 per 100K people

#8. Franklin
- Death rate for ischemic strokes, 2018-20: 25.2 per 100K people
- Death rate for hemorrhagic strokes, 2018-20: 10.3 per 100K people

#7. Martinsville
- Death rate for ischemic strokes, 2018-20: 25.9 per 100K people
- Death rate for hemorrhagic strokes, 2018-20: 17.0 per 100K people
#6. Hopewell
- Death rate for ischemic strokes, 2018-20: 22.4 per 100K people
- Death rate for hemorrhagic strokes, 2018-20: 10.0 per 100K people
You may also like: Best high schools in Virginia

#5. Danville
- Death rate for ischemic strokes, 2018-20: 26.0 per 100K people
- Death rate for hemorrhagic strokes, 2018-20: 12.0 per 100K people

#4. Brunswick County
- Death rate for ischemic strokes, 2018-20: 26.4 per 100K people
- Death rate for hemorrhagic strokes, 2018-20: 7.8 per 100K people
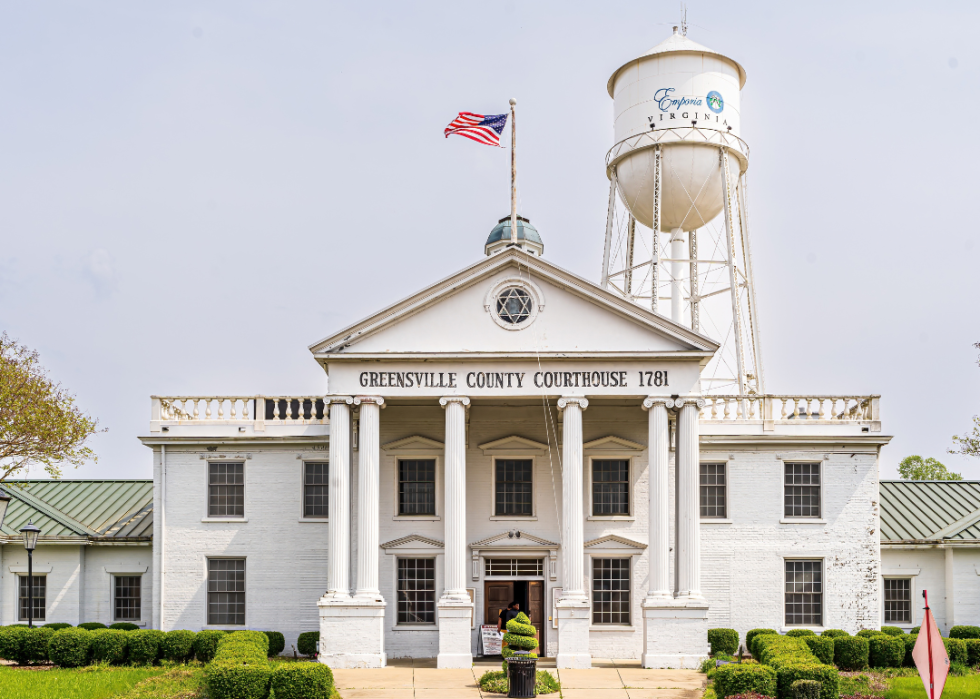
#3. Greensville County
- Death rate for ischemic strokes, 2018-20: 27.8 per 100K people
- Death rate for hemorrhagic strokes, 2018-20: 7.2 per 100K people

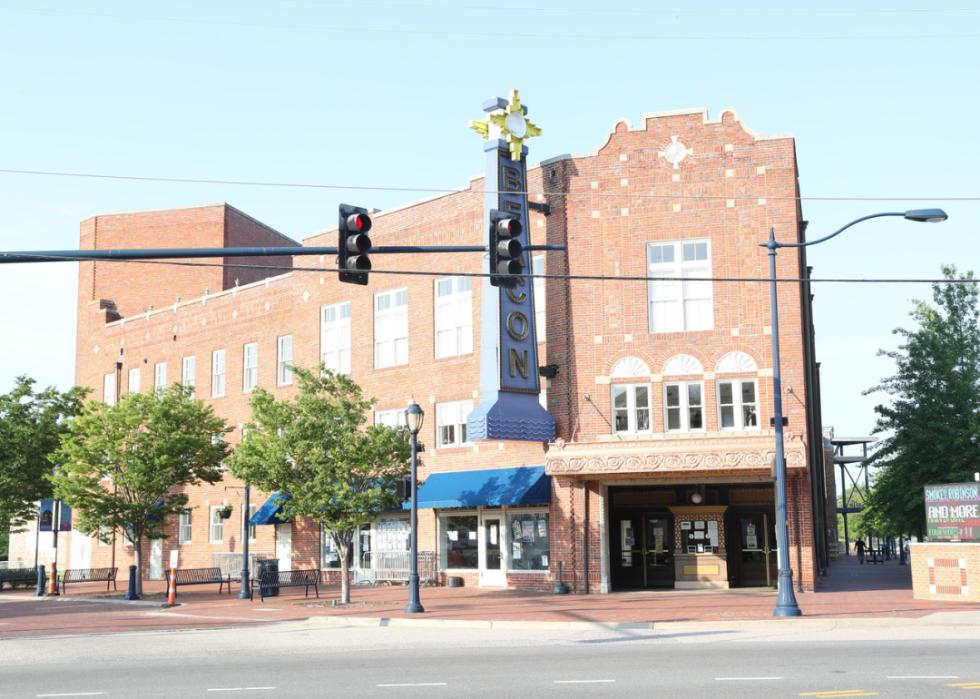
#2. Petersburg
- Death rate for ischemic strokes, 2018-20: 30.5 per 100K people
- Death rate for hemorrhagic strokes, 2018-20: 9.9 per 100K people
#1. Emporia
- Death rate for ischemic strokes, 2018-20: 38.0 per 100K people
- Death rate for hemorrhagic strokes, 2018-20: 11.8 per 100K people
You may also like: Highest NFL draft picks from Virginia
This story features data reporting and writing by Emma Rubin and is part of a series utilizing data automation across 49 states.