Counties with the most motor vehicle accident fatalities in Utah
Counties with the most motor vehicle accident fatalities in Utah
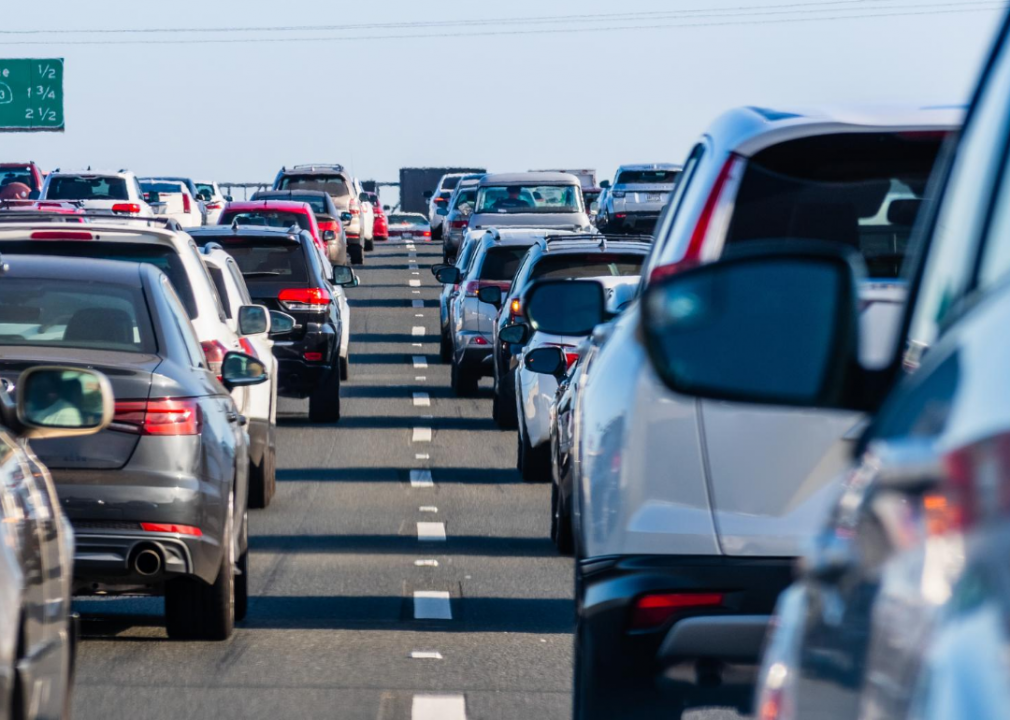
Media outlets were quick during the onset of the COVID-19 pandemic and the consequent lockdowns that defined the summer and fall of 2020 to note just how little traffic there was as a result. Simple logic would suggest that less traffic equals a lower likelihood of accidents and thus fewer injuries and fatalities. Sadly, this was not the case.
Nationwide, traffic fatalities rose 7.2% in 2020 to nearly 39,000. That number was the highest recorded since 2007. Qualifying this disturbing fact is a sticky wicket—common denominators behind traffic deaths such as impaired driving, failure to use a seat belt, and excessive speed were certainly contributing factors, but they alone do not account for a rise in deaths commensurate with a 430-million-mile drop in the number of miles people traveled across the course of the year. What can be qualified, however, is where fatal crashes took place.
Citing data from the Fatality Analysis Reporting System, compiled by the National Highway Traffic Safety Administration, Stacker identified the counties in Utah that had the most fatalities from motor vehicle crashes in 2020. The number of accident fatalities are ranked by the number of deaths per 100,000 people, with the raw number functioning as a tiebreaker. The analysis only looked at counties with at least five deaths during 2020. Additional data is included on pedestrian, bicyclist, and drunk-driving-related deaths. In counties where at least five fatalities happened on the same street or interstate, the road with the most deaths is also included.
#16. Davis County, Utah
- 1 pedestrian death
- 2 bicyclist deaths
- 5 deaths involving drunk drivers
- No roads with at least five fatalities
#15. Utah County, Utah
- 3 pedestrian deaths
- 2 bicyclist deaths
- 3 deaths involving drunk drivers
- Road with most fatalities: I-15 (6 fatalities)
#14. Cache County, Utah
- 1 pedestrian death
- 0 bicyclist deaths
- 0 deaths involving drunk drivers
- No roads with at least five fatalities
#13. Salt Lake County, Utah
- 12 pedestrian deaths
- 3 bicyclist deaths
- 21 deaths involving drunk drivers
- Road with most fatalities: SR-68 (6 fatalities)
#12. Washington County, Utah
- 1 pedestrian death
- 0 bicyclist deaths
- 3 deaths involving drunk drivers
- No roads with at least five fatalities
#11. Box Elder County, Utah
- 2 pedestrian deaths
- 0 bicyclist deaths
- 1 death involving drunk drivers
- No roads with at least five fatalities
#10. Summit County, Utah
- 1 pedestrian death
- 0 bicyclist deaths
- 2 deaths involving drunk drivers
- No roads with at least five fatalities
#9. Tooele County, Utah
- 2 pedestrian deaths
- 0 bicyclist deaths
- 3 deaths involving drunk drivers
- No roads with at least five fatalities
#8. Iron County, Utah
- 0 pedestrian deaths
- 0 bicyclist deaths
- 1 death involving drunk drivers
- Road with most fatalities: I-15 (5 fatalities)
#7. Duchesne County, Utah
- 2 pedestrian deaths
- 0 bicyclist deaths
- 0 deaths involving drunk drivers
- No roads with at least five fatalities
#6. Sevier County, Utah
- 0 pedestrian deaths
- 0 bicyclist deaths
- 2 deaths involving drunk drivers
- No roads with at least five fatalities
#5. Carbon County, Utah
- 1 pedestrian death
- 0 bicyclist deaths
- 1 death involving drunk drivers
- No roads with at least five fatalities
#4. San Juan County, Utah
- 0 pedestrian deaths
- 0 bicyclist deaths
- 2 deaths involving drunk drivers
- No roads with at least five fatalities
#3. Grand County, Utah
- 0 pedestrian deaths
- 0 bicyclist deaths
- 0 deaths involving drunk drivers
- No roads with at least five fatalities
#2. Millard County, Utah
- 0 pedestrian deaths
- 0 bicyclist deaths
- 4 deaths involving drunk drivers
- No roads with at least five fatalities
#1. Juab County, Utah
- 1 pedestrian death
- 0 bicyclist deaths
- 0 deaths involving drunk drivers
- No roads with at least five fatalities