Warmest and coldest January in Bowie County, Texas history
Warmest and coldest January in Bowie County, Texas history
2024 has started off with intense cold and severe weather across much of the U.S.
Storms caused flooding in the Northeast, tornadoes in the South, and deep snow in the Midwest and New England.
Minneapolis saw lows of -8 F over Martin Luther King Jr. weekend. Further South, Dallas experienced temperatures into the teens, unusual for a city with an average January temperature of 45.2 F.
Global average temperatures continue to increase over the long term, but the effects of human-caused climate change don't always mean warmer winters and hotter summers. Extreme weather events can always disrupt longer-term trends. Warmer global temperatures also increase atmospheric moisture, fueling storm systems.
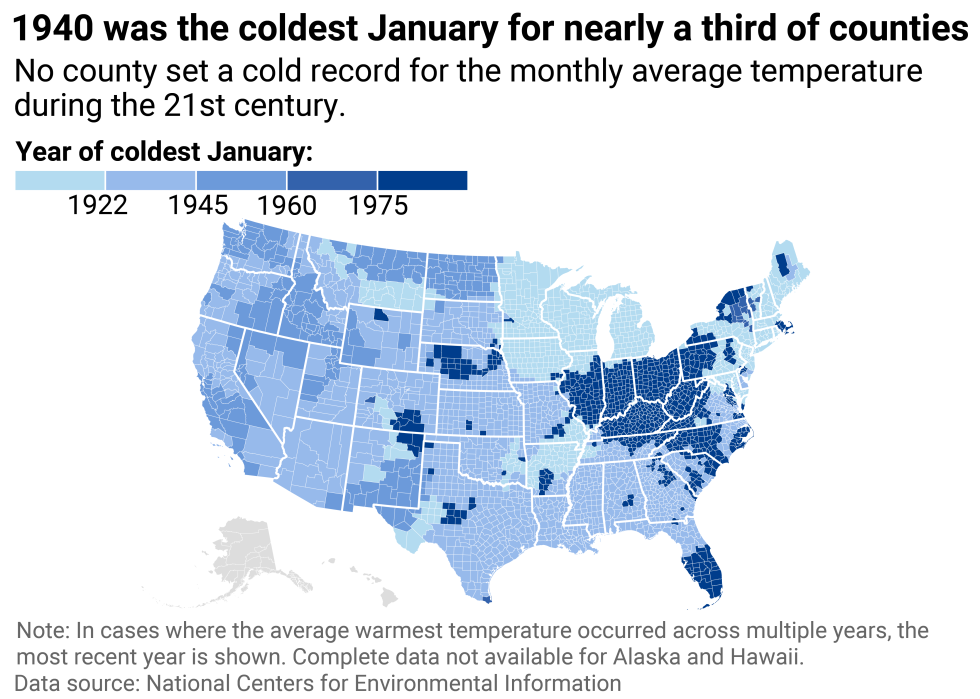
This frosty January comes after nearly 14% of counties experienced their warmest December on record. For another 20%, it was the second-warmest December they've experienced.
So what caused this spat of extreme winter weather in the first month of 2024? It's difficult for scientists to attribute every weather event to a specific cause, but a "sudden stratospheric warming" event in the Arctic recently ruptured the polar vortex, a high-pressure system that typically contains frigid air to the North Pole. That disruption widened the span of the vortex, bringing it into parts of Canada and the U.S.—and spreading colder temperatures across the Northern Hemisphere.
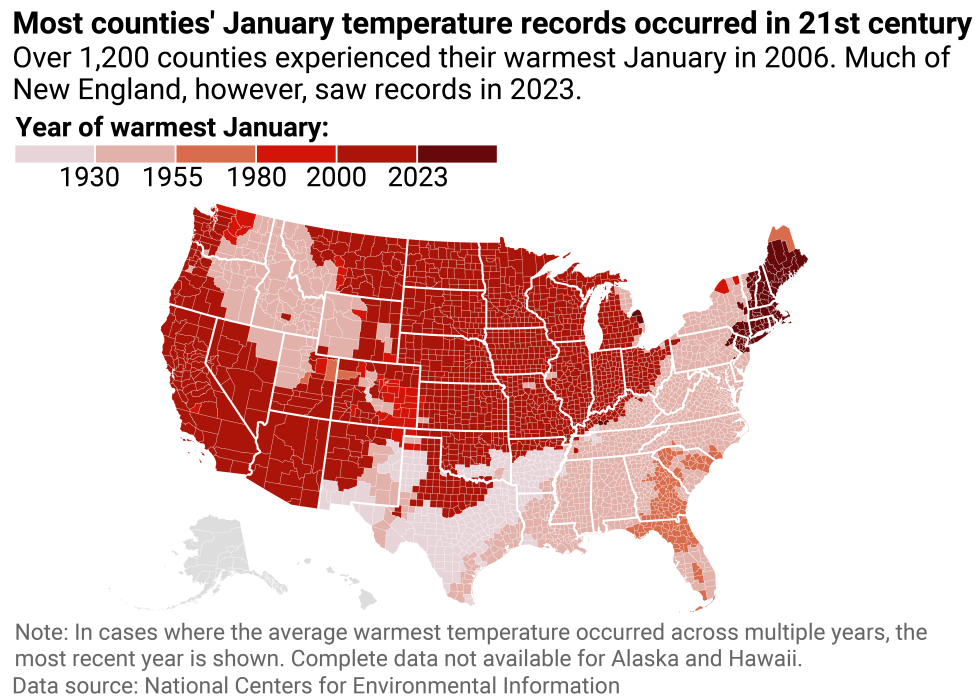
Temperatures in the contiguous U.S. for January have varied over the past century. The average temperature for the month from 1901-2000 was 30.12 degrees.
Across the continental U.S., the average yearly temperatures can be compared to this 20th-century long-term average to find how uncommon a year's climate was. The nation's warmest January on record was in 2006, when the average temperature reached 38.93 degrees, or 8.81 degrees above the long-term average. January 2023 was the sixth highest on record at 35.15 degrees.
The average January temperature in Bowie County, Texas from 1901-2000 was 43.2 degrees.
When did Bowie County, Texas experience its warmest January? And what about its coldest? To find out, Stacker used data from the National Centers for Environmental Information to identify the 15 Januaries with the highest and lowest average temperatures since 1895. Also included is how that year's temperature compared to the 1901-2000 average.
The end of the month will soon reveal where 2024's average temperature falls. For now, Stacker examined the range from 1895-2023.
Read on to see if you lived through the warmest and coldest January in Bowie County, Texas history.
Warmest Januaries
#15. 1999
- Average temperature: 47.9 F
- 4.7 F above 1901-2000 average
#14. 2012
- Average temperature: 48.5 F
- 5.3 F above 1901-2000 average
#13. 2005
- Average temperature: 48.6 F
- 5.4 F above 1901-2000 average
#12. 1914
- Average temperature: 48.7 F
- 5.5 F above 1901-2000 average
#11. 1990
- Average temperature: 49.3 F
- 6.1 F above 1901-2000 average
#10. 2017
- Average temperature: 50.1 F
- 6.9 F above 1901-2000 average
#8. 1921 (tie)
- Average temperature: 50.2 F
- 7.0 F above 1901-2000 average
#8. 1911 (tie)
- Average temperature: 50.2 F
- 7.0 F above 1901-2000 average
#7. 1933
- Average temperature: 50.6 F
- 7.4 F above 1901-2000 average
#6. 1950
- Average temperature: 51.1 F
- 7.9 F above 1901-2000 average
#5. 1952
- Average temperature: 51.3 F
- 8.1 F above 1901-2000 average
#2. 2023 (tie)
- Average temperature: 51.4 F
- 8.2 F above 1901-2000 average
#2. 2006 (tie)
- Average temperature: 51.4 F
- 8.2 F above 1901-2000 average
#2. 1923 (tie)
- Average temperature: 51.4 F
- 8.2 F above 1901-2000 average
#1. 1907
- Average temperature: 53.7 F
- 10.5 F above 1901-2000 average
Coldest Januaries
#15. 1924
- Average temperature: 38.9 F
- 4.3 F below 1901-2000 average
#14. 1970
- Average temperature: 38.7 F
- 4.5 F below 1901-2000 average
#13. 1962
- Average temperature: 38.1 F
- 5.1 F below 1901-2000 average
#12. 1984
- Average temperature: 37.8 F
- 5.4 F below 1901-2000 average
#10. 1905 (tie)
- Average temperature: 37.7 F
- 5.5 F below 1901-2000 average
#10. 1912 (tie)
- Average temperature: 37.7 F
- 5.5 F below 1901-2000 average
#9. 1985
- Average temperature: 37.3 F
- 5.9 F below 1901-2000 average
#8. 1948
- Average temperature: 36.1 F
- 7.1 F below 1901-2000 average
#7. 1963
- Average temperature: 35.6 F
- 7.6 F below 1901-2000 average
#6. 1930
- Average temperature: 35.1 F
- 8.1 F below 1901-2000 average
#5. 1977
- Average temperature: 33.7 F
- 9.5 F below 1901-2000 average
#4. 1918
- Average temperature: 33.2 F
- 10.0 F below 1901-2000 average
#3. 1979
- Average temperature: 33.1 F
- 10.1 F below 1901-2000 average
#2. 1978
- Average temperature: 33.0 F
- 10.2 F below 1901-2000 average
#1. 1940
- Average temperature: 32.2 F
- 11.0 F below 1901-2000 average
This story features data reporting and writing by Emma Rubin and is part of a series utilizing data automation across 3,093 counties.