Metros where renters are the most overextended in Tennessee
This story originally appeared on Belong and was produced and distributed in partnership with Stacker Studio.
Metros where renters are the most overextended in Tennessee
Anyone who has recently gone hunting for a new apartment to rent in a major city experiences the same headache. It seems like every year, rent prices go up while availability goes down.
Renters aren't just imagining this: From about 2010 to 2019, average rent for apartments across the U.S. has increased by around 2% to 5% annually, with a massive dip, followed by a surge, once the COVID-19 pandemic hit. From 2020 to 2022 alone, rent prices increased by 15%.
At the same time, wages have remained mostly stagnant. This has led to an affordability crisis: Many renters are familiar with the traditional recommendation of paying no more than 30% of a person's income in rent, but as prices go up while salaries stay the same, this may no longer be feasible for many.
Belong examined Census Bureau data to see where renters in Tennessee are putting the largest share of their income toward rent. Metros are ranked by the median gross rent as a percentage of household income. In the event of a tie, the share of renter-occupied homes in that metro were used.
Some areas have been hit harder than others. For instance, many of the listed cities are home to prominent universities and colleges, where there is high competition for limited units, causing a spike in rent.
Nationally, cities in the Sun Belt—including those in Florida, Texas, and other Southern states—experienced rent surges during the onset of the pandemic, when many workers left cities in colder climates to work remotely in sunnier areas. As a result, as many as 70% of apartments being built to fill demand in those areas are luxury units, with enviable amenities such as rooftop pools, on-premises spas, and coworking spaces.
Thankfully, the skyrocketing rates are thought to finally be cooling down a bit, at least in part due to increased housing availability. Nearly 1 million new apartments are currently being constructed across the country, popping up at the highest rate in 50 years. If this trend continues, renters may be able to let their wallets breathe a little more in the coming years.
See how Tennessee compares to the rest of the country.

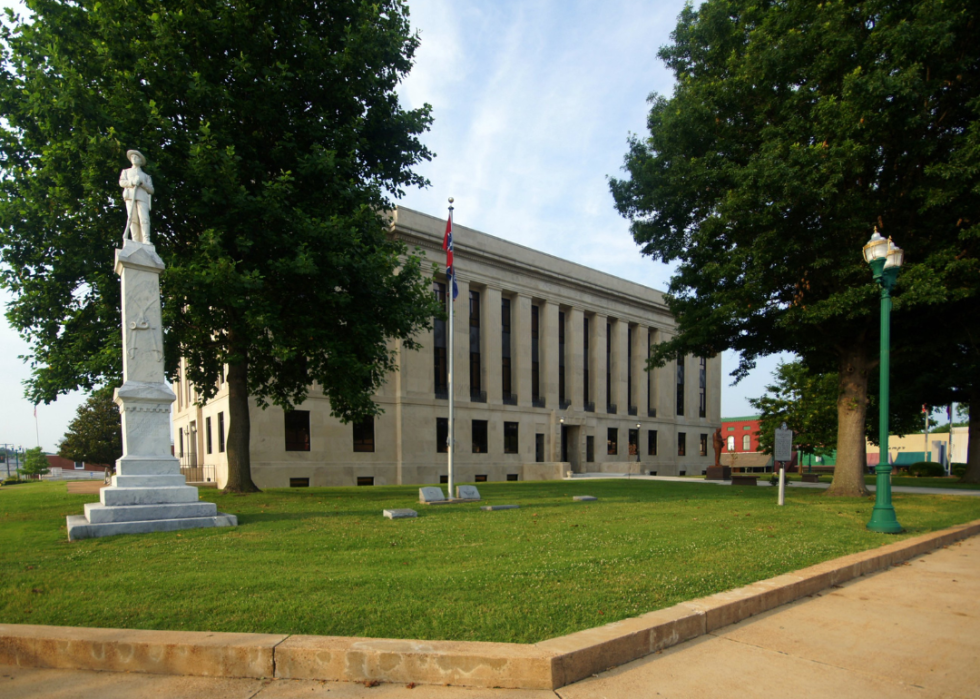
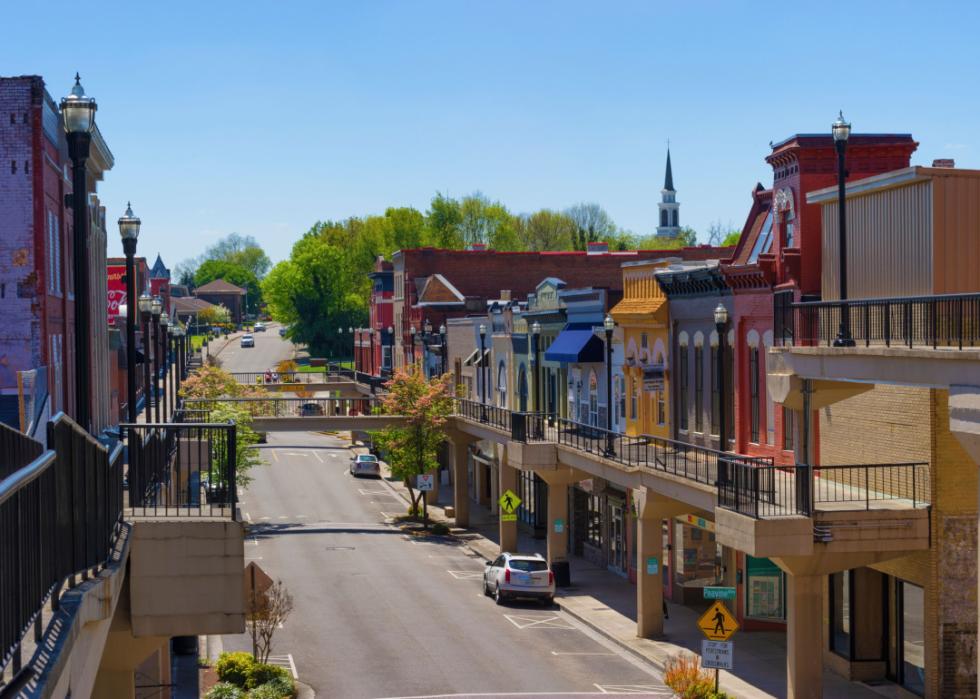
#25. Union City
- Median rent: $666
- Number of renter-occupied homes: 4,391 (35.1% of all housing units)

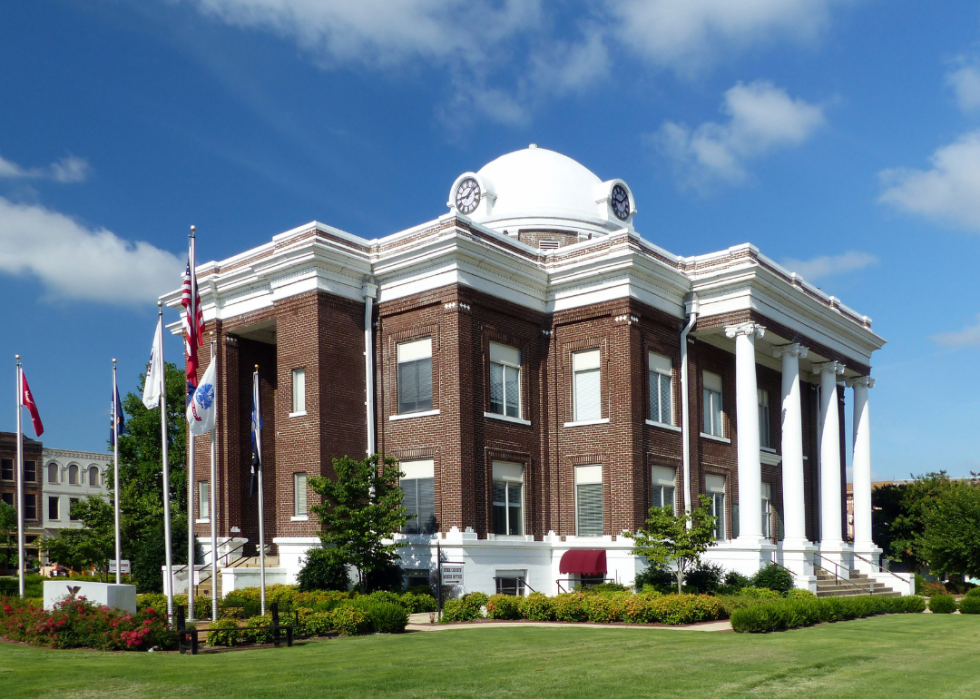
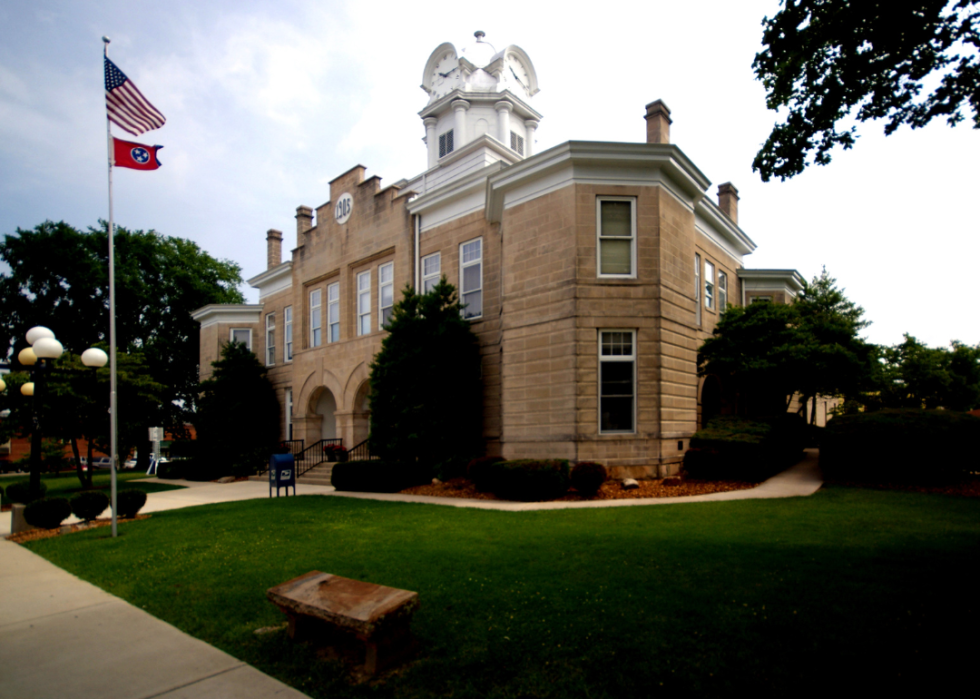
#24. Dayton
- Median rent: $691
- Number of renter-occupied homes: 3,405 (26.7% of all housing units)
#23. Shelbyville
- Median rent: $801
- Number of renter-occupied homes: 5,279 (29.5% of all housing units)
#22. Martin
- Median rent: $657
- Number of renter-occupied homes: 4,400 (33.3% of all housing units)
#21. Dyersburg
- Median rent: $698
- Number of renter-occupied homes: 5,399 (36.8% of all housing units)
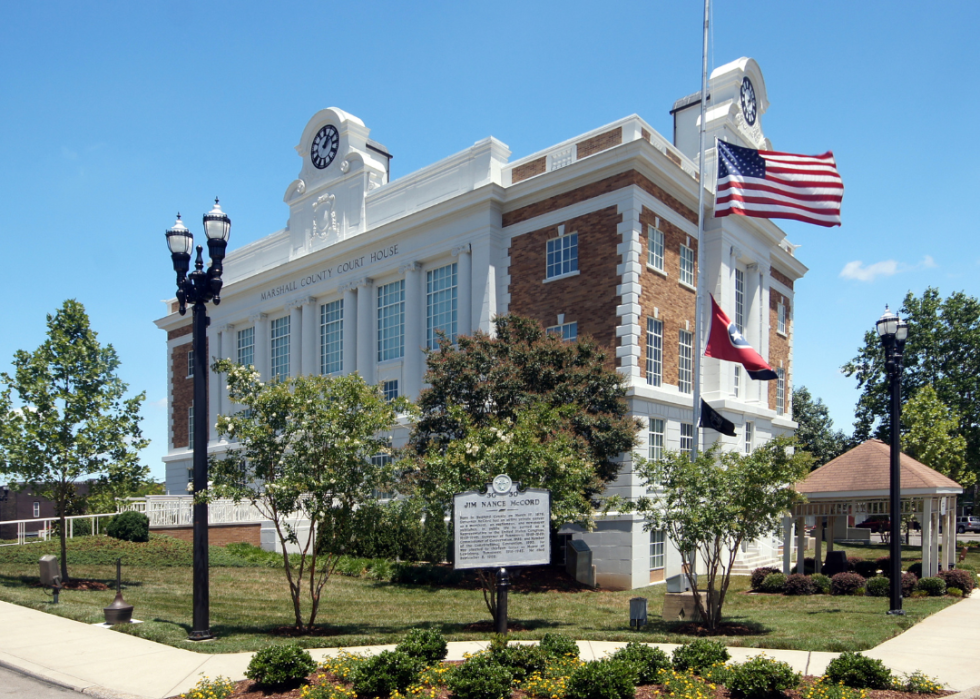
#20. Lewisburg
- Median rent: $823
- Number of renter-occupied homes: 3,365 (26.5% of all housing units)
#19. Kingsport
- Median rent: $717
- Number of renter-occupied homes: 33,875 (26.6% of all housing units)
#18. Crossville
- Median rent: $750
- Number of renter-occupied homes: 5,676 (21.4% of all housing units)
#17. Tullahoma
- Median rent: $756
- Number of renter-occupied homes: 11,879 (28.7% of all housing units)
#16. Paris
- Median rent: $681
- Number of renter-occupied homes: 3,093 (23.9% of all housing units)
#15. McMinnville
- Median rent: $679
- Number of renter-occupied homes: 4,690 (29.7% of all housing units)
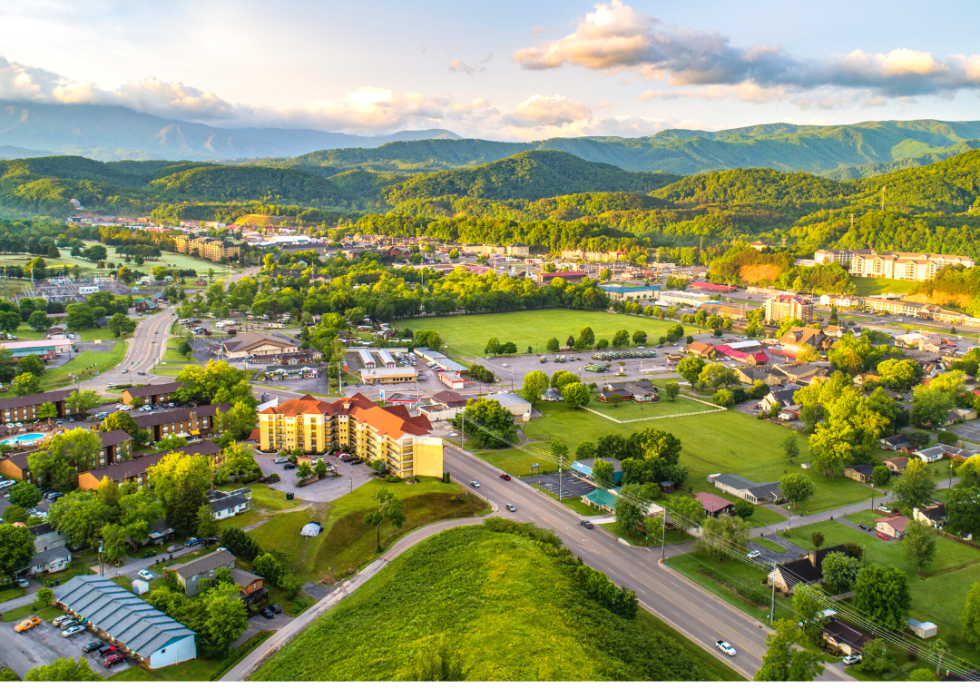
#14. Sevierville
- Median rent: $873
- Number of renter-occupied homes: 10,316 (28.0% of all housing units)

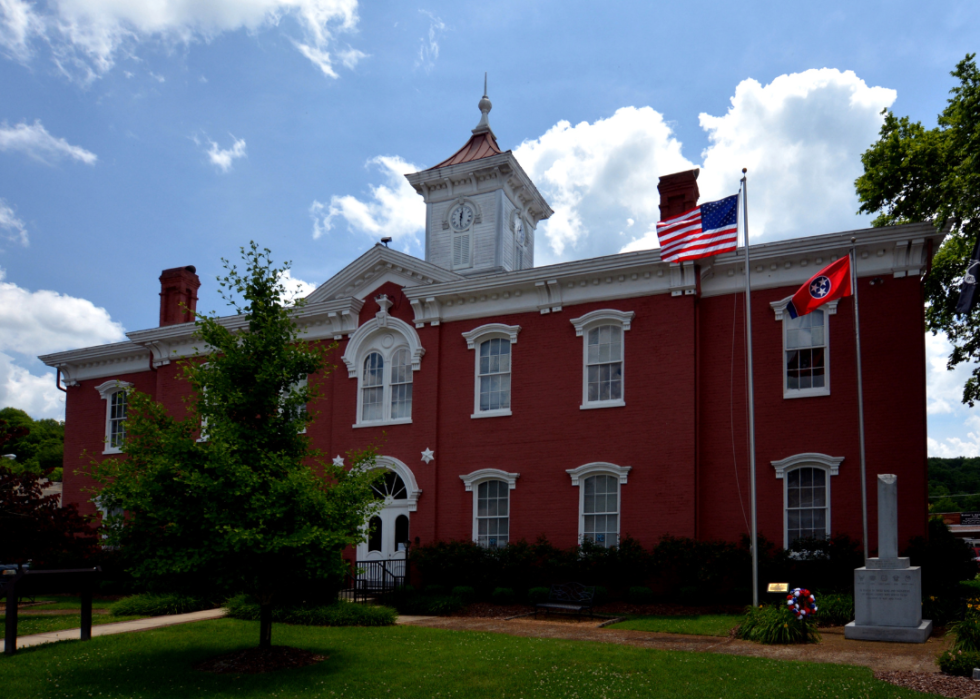
#13. Newport
- Median rent: $720
- Number of renter-occupied homes: 4,237 (29.6% of all housing units)
#12. Lawrenceburg
- Median rent: $685
- Number of renter-occupied homes: 4,239 (25.7% of all housing units)
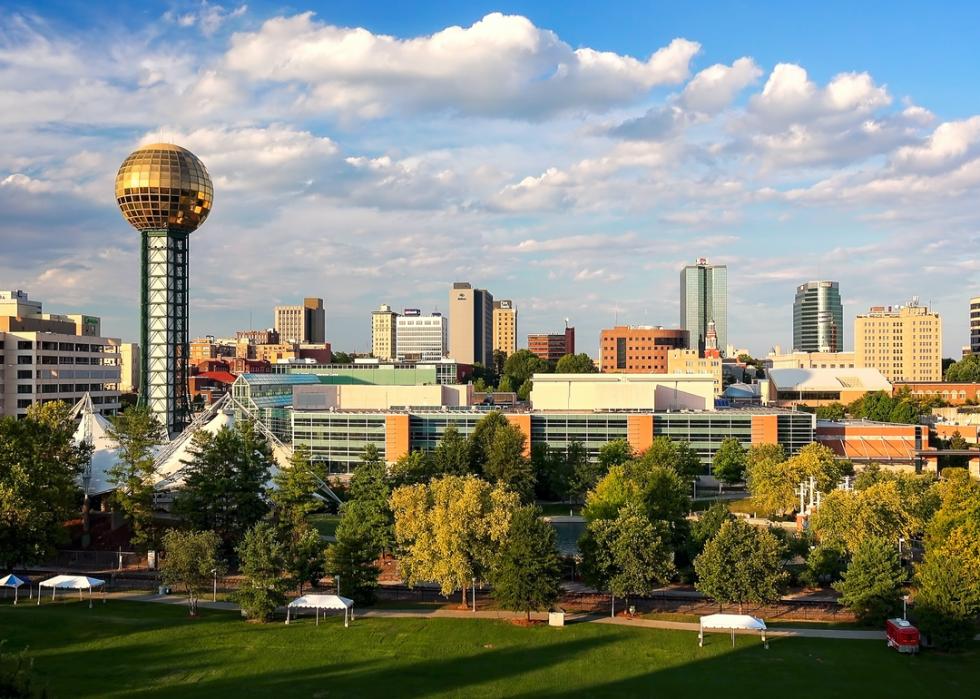
#11. Knoxville
- Median rent: $920
- Number of renter-occupied homes: 107,131 (30.7% of all housing units)
#10. Cleveland
- Median rent: $810
- Number of renter-occupied homes: 15,127 (31.5% of all housing units)
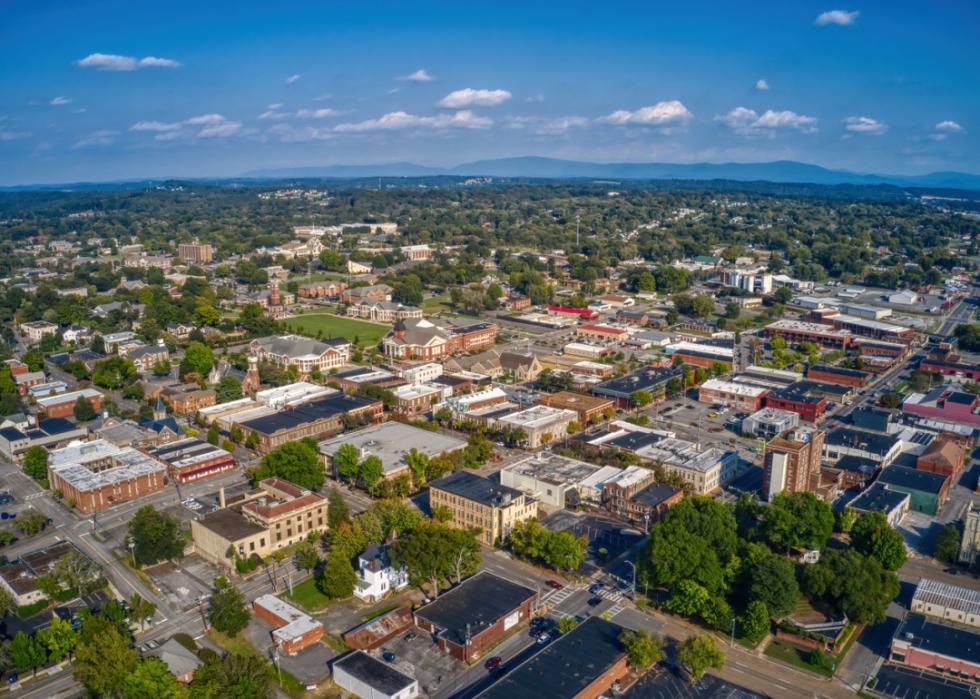
#9. Morristown
- Median rent: $741
- Number of renter-occupied homes: 15,321 (28.3% of all housing units)
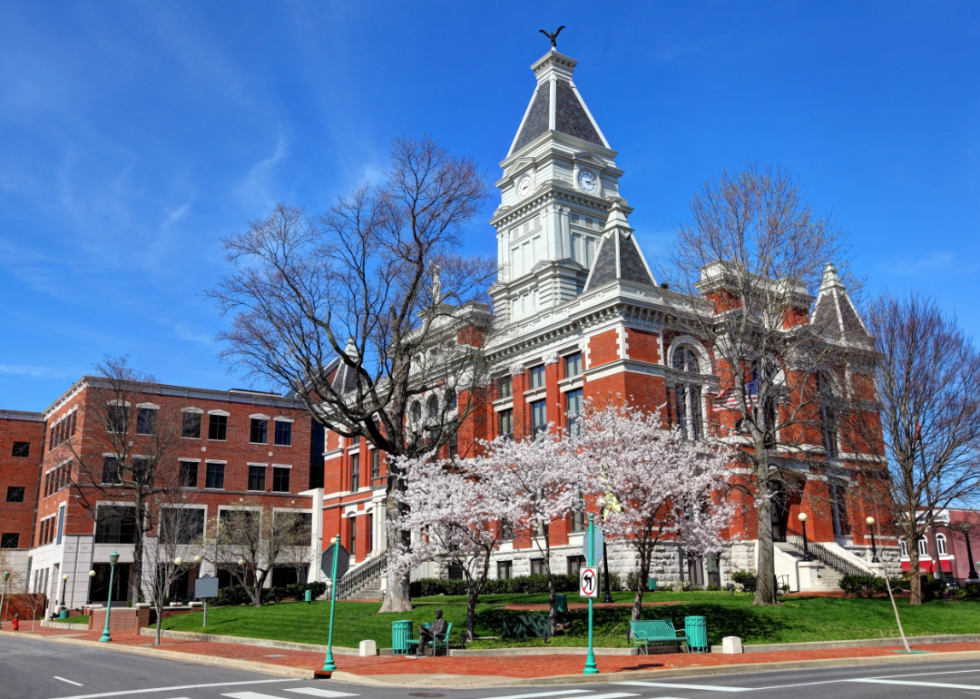
#8. Clarksville
- Median rent: $967
- Number of renter-occupied homes: 44,762 (39.3% of all housing units)
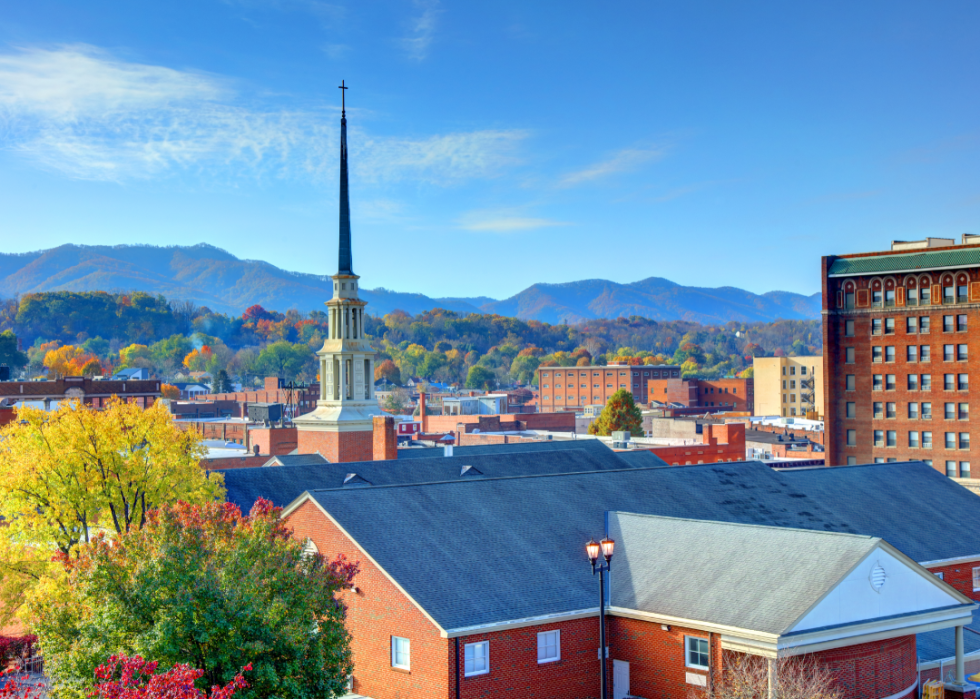
#7. Johnson City
- Median rent: $769
- Number of renter-occupied homes: 27,883 (32.4% of all housing units)

#6. Chattanooga
- Median rent: $913
- Number of renter-occupied homes: 73,041 (32.9% of all housing units)
#5. Cookeville
- Median rent: $768
- Number of renter-occupied homes: 14,811 (32.8% of all housing units)

#4. Nashville
- Median rent: $1,211
- Number of renter-occupied homes: 254,616 (34.0% of all housing units)
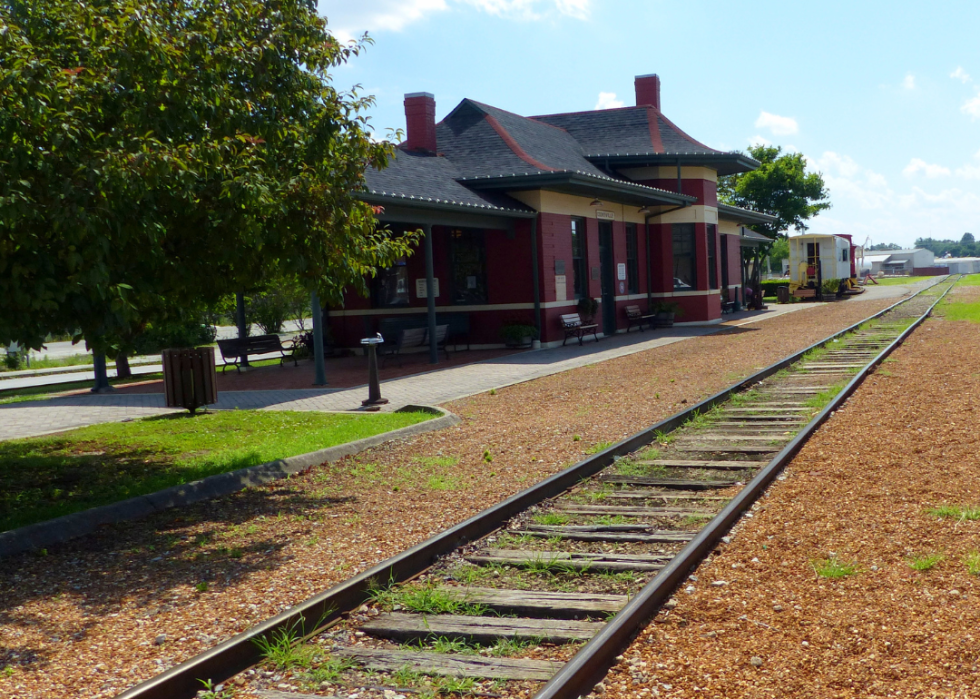
#3. Brownsville
- Median rent: $668
- Number of renter-occupied homes: 2,926 (41.1% of all housing units)
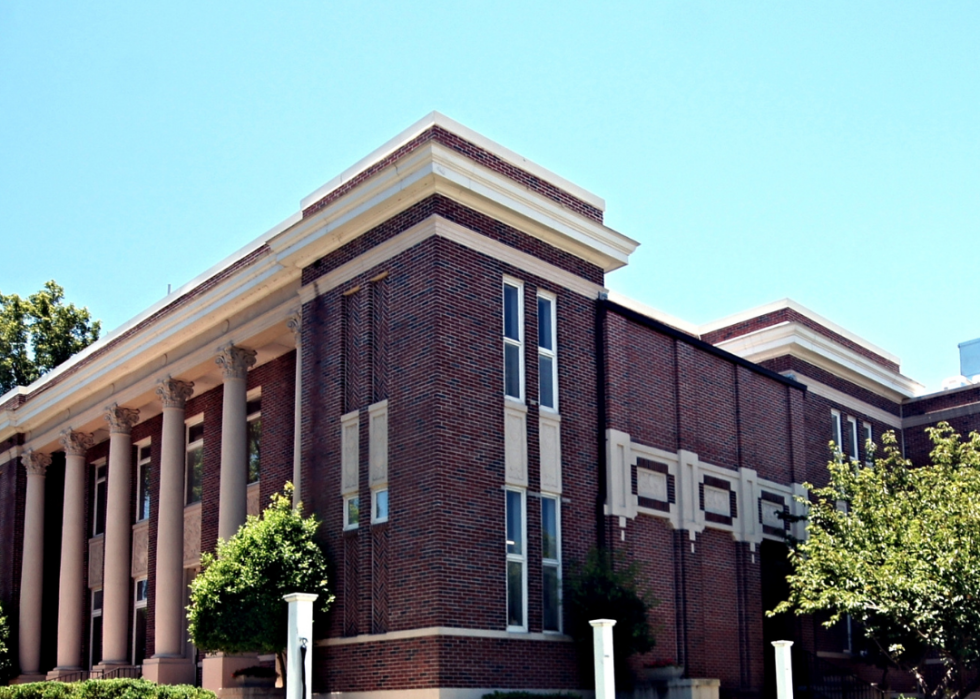
#2. Jackson
- Median rent: $827
- Number of renter-occupied homes: 23,979 (34.4% of all housing units)

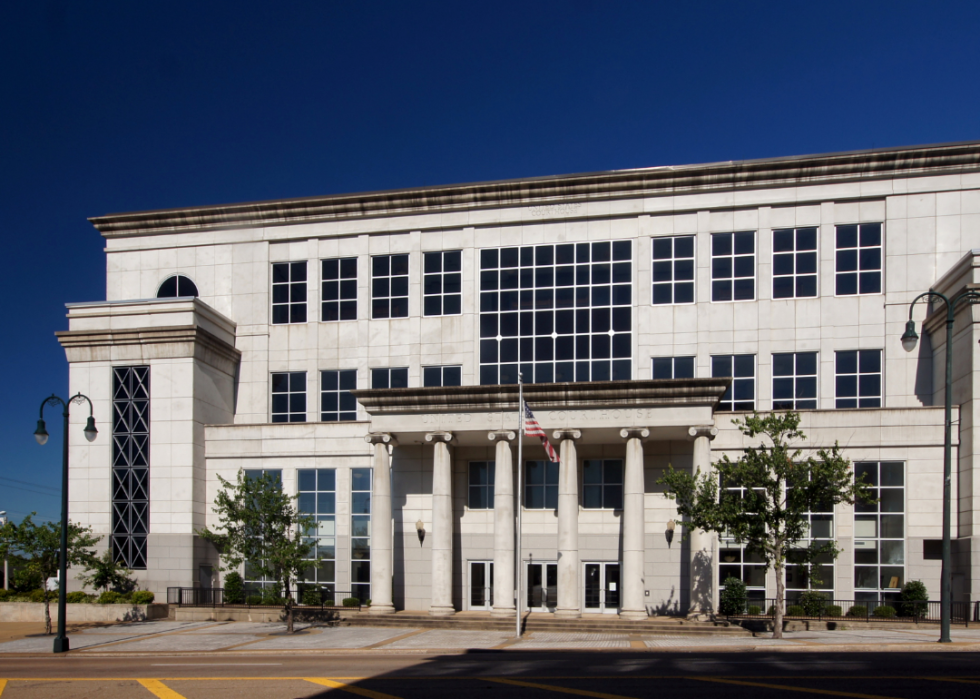
#1. Memphis
- Median rent: $998
- Number of renter-occupied homes: 198,260 (39.3% of all housing units)
This story features data reporting by Elena Cox, writing by Andrea Vale, and is part of a series utilizing data automation across 50 states.