Cities with the most expensive homes in South Carolina
Cities with the most expensive homes in South Carolina
Purchasing a home is among the most important investments a person will make in their lifetime. More than a place to live, homeownership is an asset with the potential to tremendously rise in value. But with home prices reaching record heights, affordability plays a huge role—and, increasingly, is a huge barrier—for buyers.
In March, the typical home value in the United States was $355,696—4.6% higher than the previous year.
High mortgage rates have also had a major impact on affordability: As of April 25, the 30-year fixed mortgage rate stands at 7.17%, three points higher than the average mortgage American households are sitting on. That disparity has kept many people in homes they might otherwise leave—to pursue another job, to downsize, or to upsize—further squeezing an already-tight market.
While home prices are up across the U.S., certain cities command significantly higher prices than others. Location, size, age, and condition are all contributing factors to home values.
Stacker compiled a list of cities with the most expensive homes in South Carolina using data from Zillow. Cities are ranked by the Zillow Home Values Index for all homes as of March 2024. The charts in this story were created automatically using Matplotlib.
Metros with the most cities in the top 30 in South Carolina
#1. Charleston-North Charleston, SC: 16
#2. Hilton Head Island-Bluffton, SC: 5
#3. Charlotte-Concord-Gastonia, NC-SC: 3
#4. Augusta-Richmond County, GA-SC: 1
#4. Columbia, SC: 1
#4. Georgetown, SC: 1
#4. Greenville-Anderson, SC: 1
#4. Myrtle Beach-Conway-North Myrtle Beach, SC-NC: 1
#4. Seneca, SC: 1
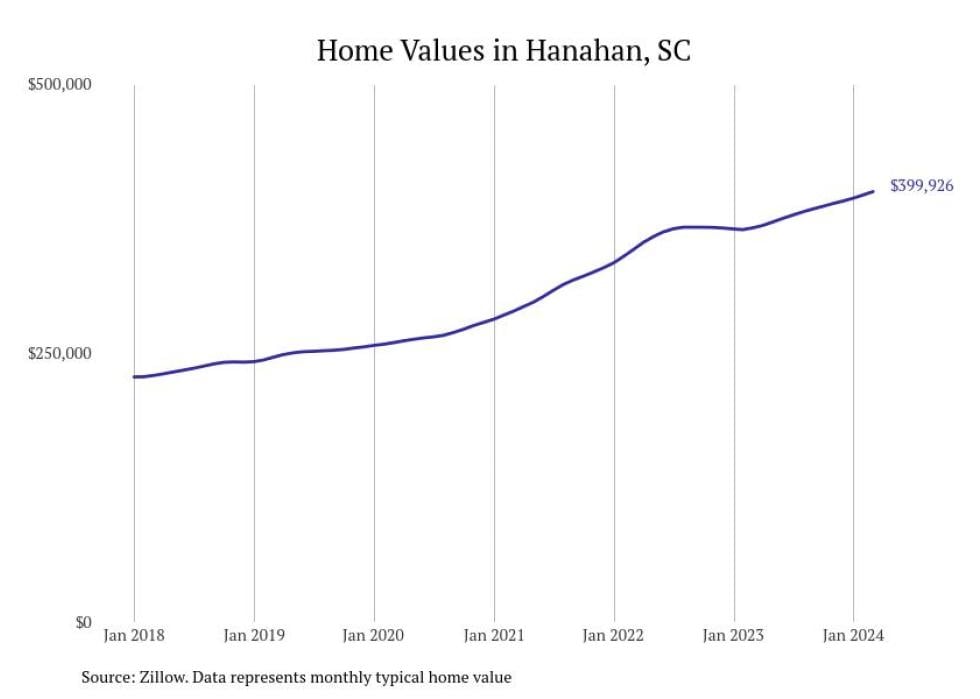
#30. Hanahan
- Typical home value: $399,926
- 1-year price change: +9.2%
- 5-year price change: +62.5%
- Metro area: Charleston-North Charleston, SC
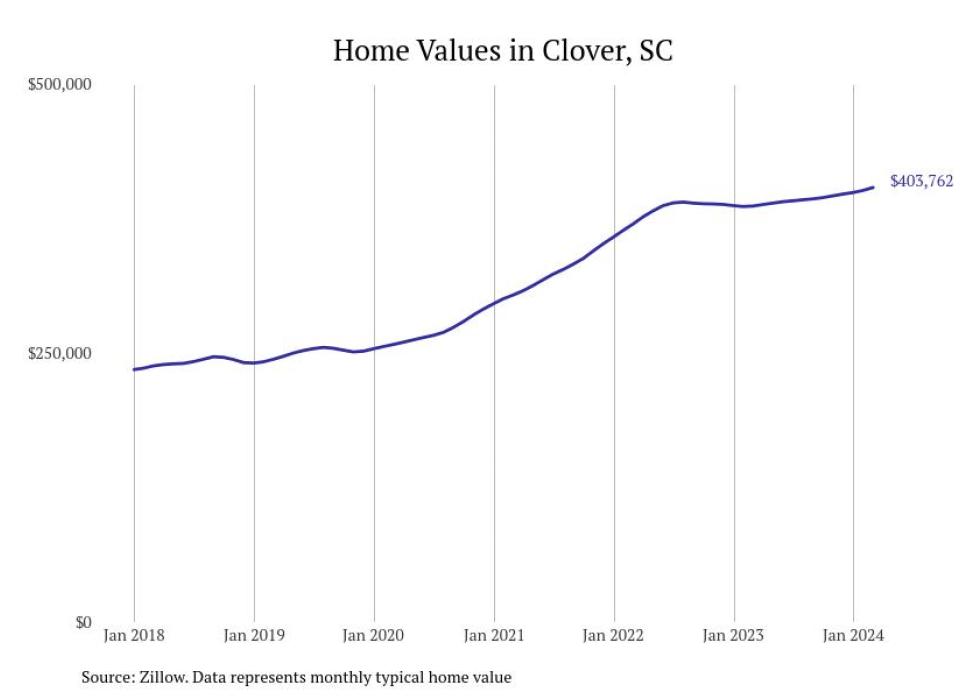
#29. Clover
- Typical home value: $403,762
- 1-year price change: +4.5%
- 5-year price change: +65.4%
- Metro area: Charlotte-Concord-Gastonia, NC-SC
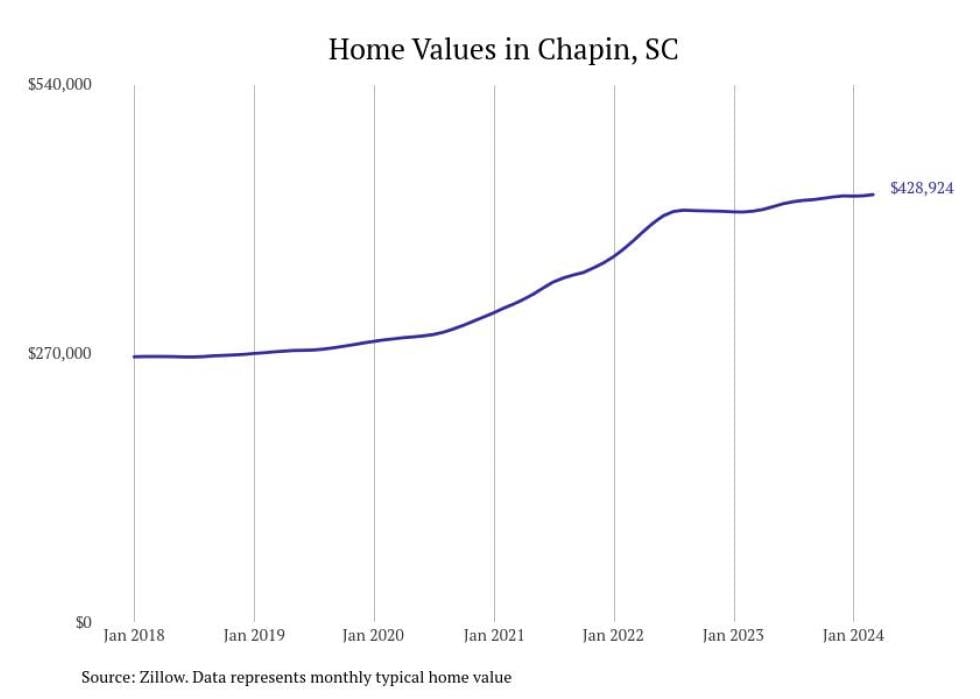
#28. Chapin
- Typical home value: $428,924
- 1-year price change: +4.0%
- 5-year price change: +58.2%
- Metro area: Columbia, SC
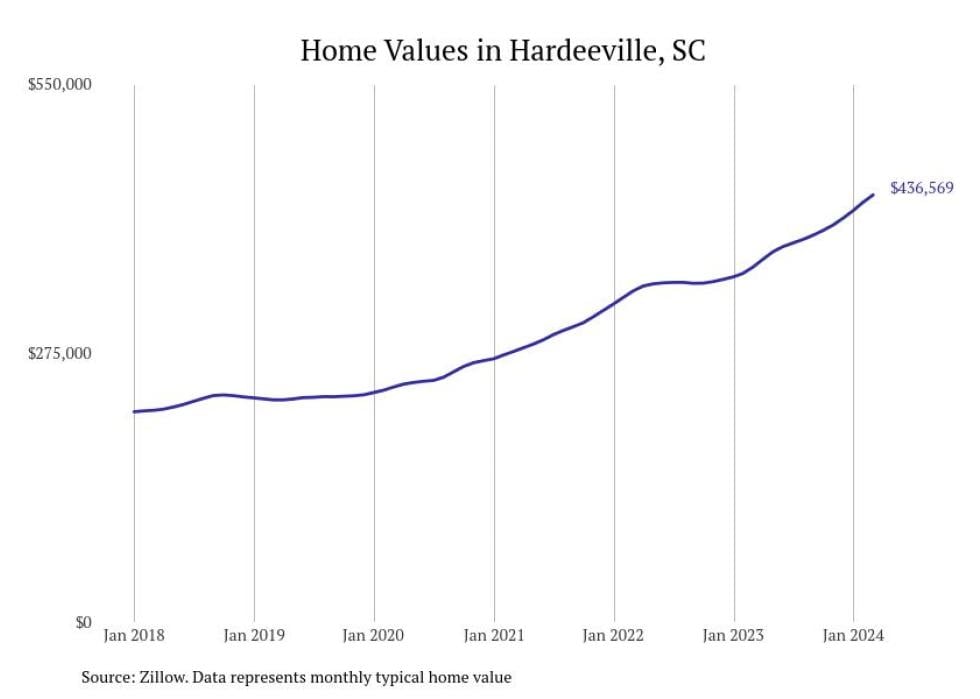
#27. Hardeeville
- Typical home value: $436,569
- 1-year price change: +20.3%
- 5-year price change: +92.2%
- Metro area: Hilton Head Island-Bluffton, SC
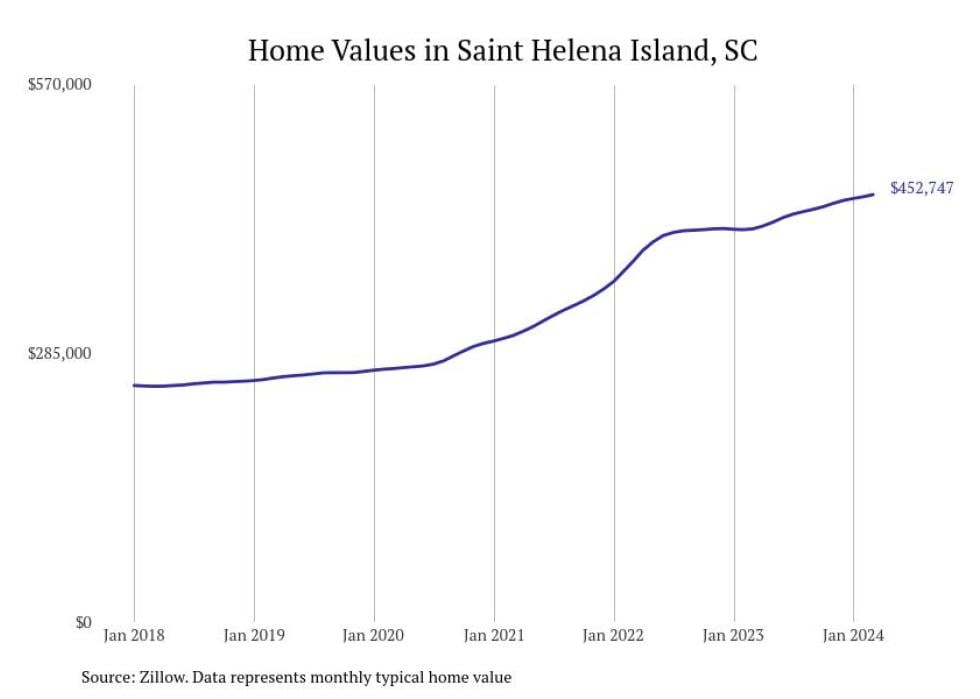
#26. Saint Helena Island
- Typical home value: $452,747
- 1-year price change: +8.7%
- 5-year price change: +75.1%
- Metro area: Hilton Head Island-Bluffton, SC
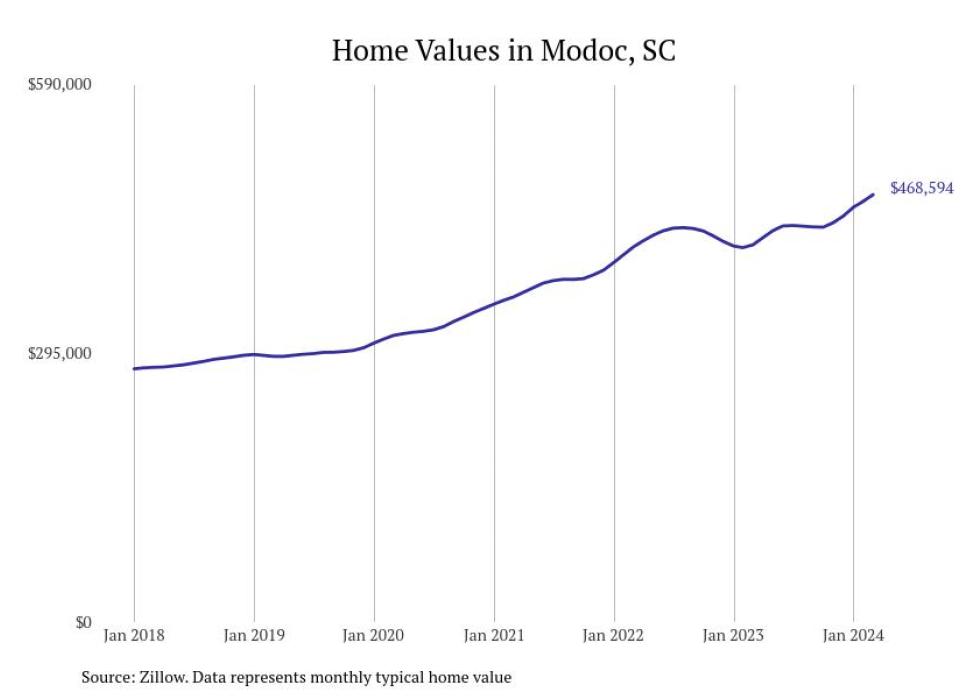
#25. Modoc
- Typical home value: $468,594
- 1-year price change: +13.3%
- 5-year price change: +60.9%
- Metro area: Augusta-Richmond County, GA-SC
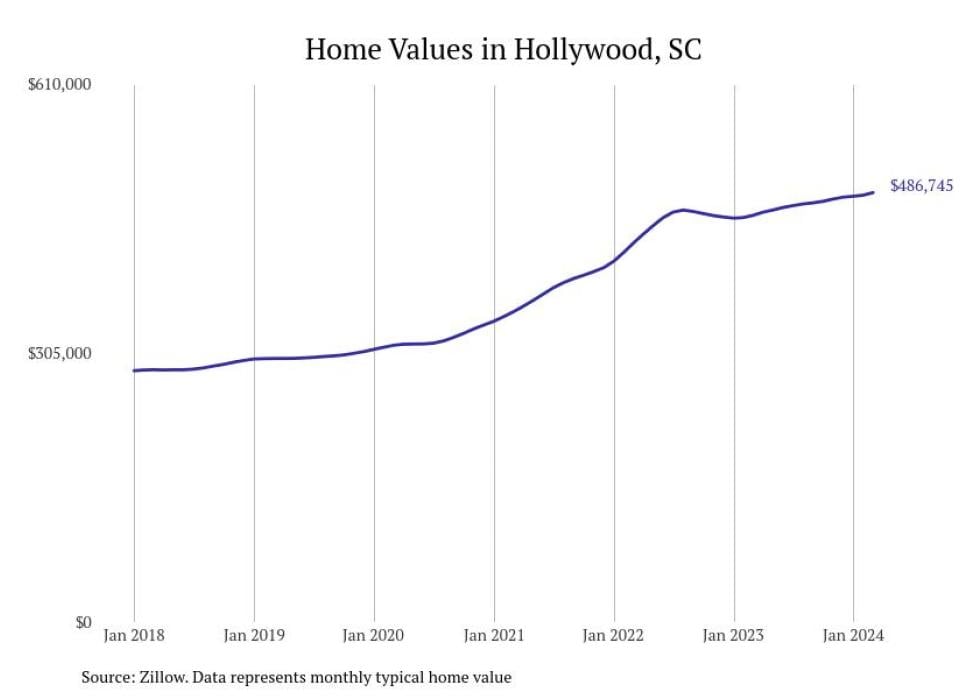
#24. Hollywood
- Typical home value: $486,745
- 1-year price change: +5.6%
- 5-year price change: +62.9%
- Metro area: Charleston-North Charleston, SC
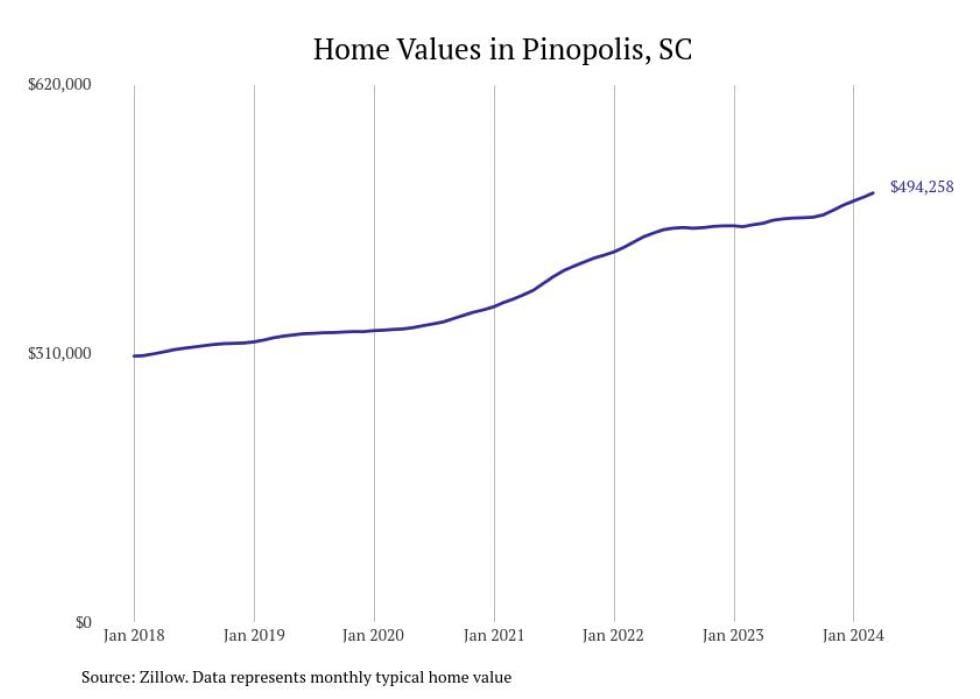
#23. Pinopolis
- Typical home value: $494,258
- 1-year price change: +8.0%
- 5-year price change: +50.9%
- Metro area: Charleston-North Charleston, SC
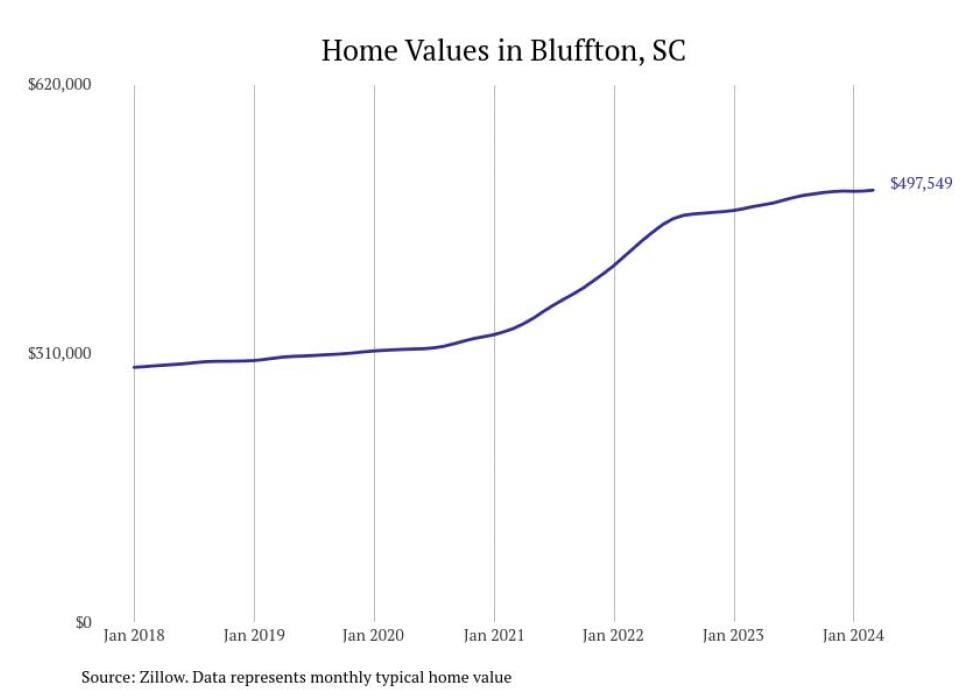
#22. Bluffton
- Typical home value: $497,549
- 1-year price change: +4.0%
- 5-year price change: +63.7%
- Metro area: Hilton Head Island-Bluffton, SC
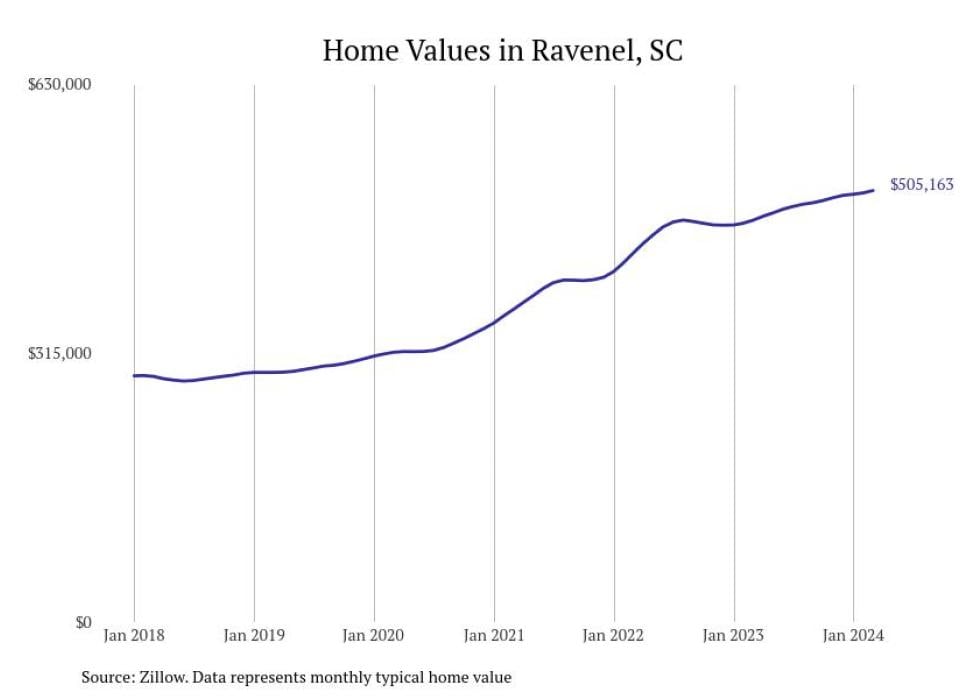
#21. Ravenel
- Typical home value: $505,163
- 1-year price change: +7.4%
- 5-year price change: +72.8%
- Metro area: Charleston-North Charleston, SC
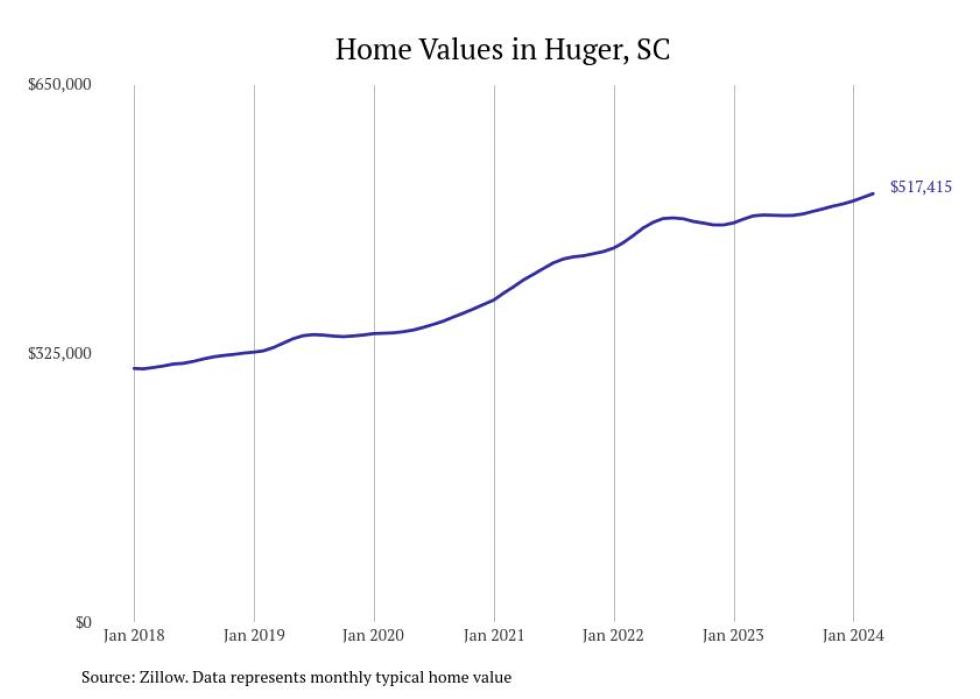
#20. Huger
- Typical home value: $517,415
- 1-year price change: +5.5%
- 5-year price change: +56.1%
- Metro area: Charleston-North Charleston, SC
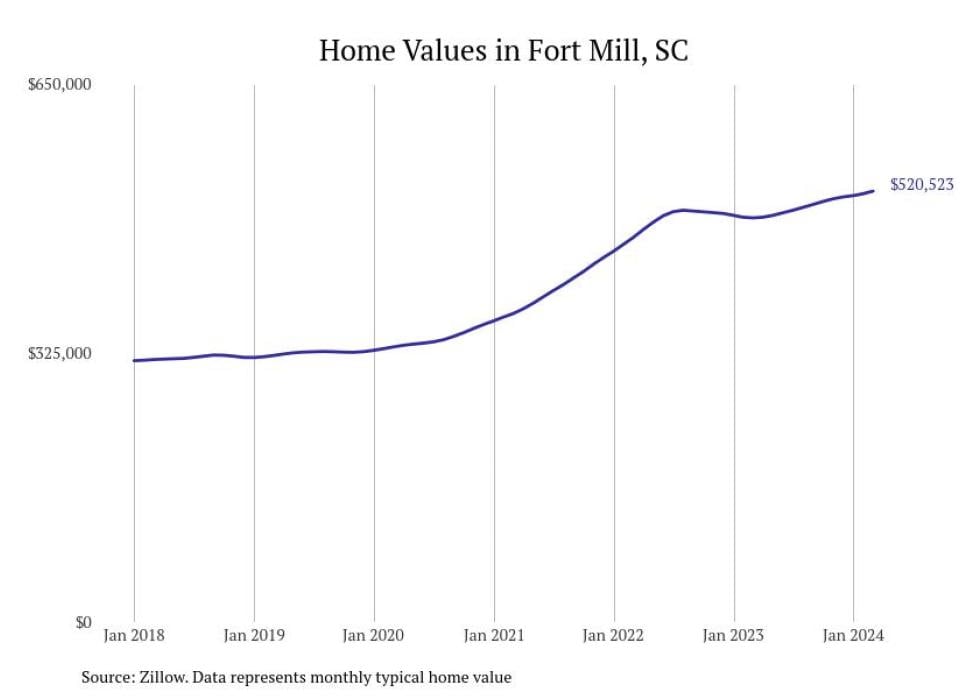
#19. Fort Mill
- Typical home value: $520,523
- 1-year price change: +6.6%
- 5-year price change: +61.7%
- Metro area: Charlotte-Concord-Gastonia, NC-SC
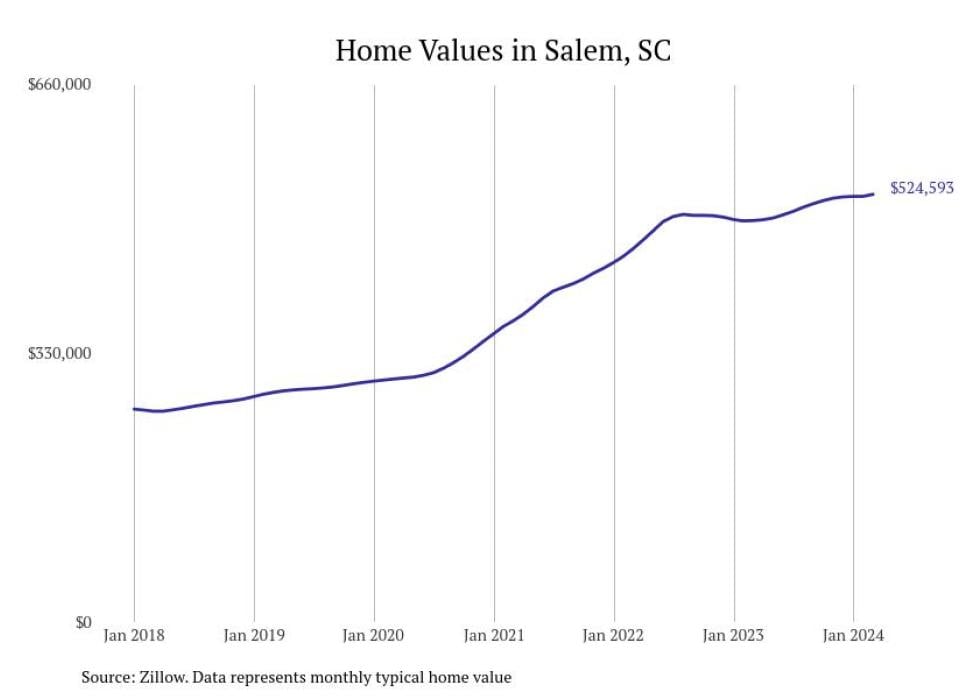
#18. Salem
- Typical home value: $524,593
- 1-year price change: +6.5%
- 5-year price change: +86.2%
- Metro area: Seneca, SC
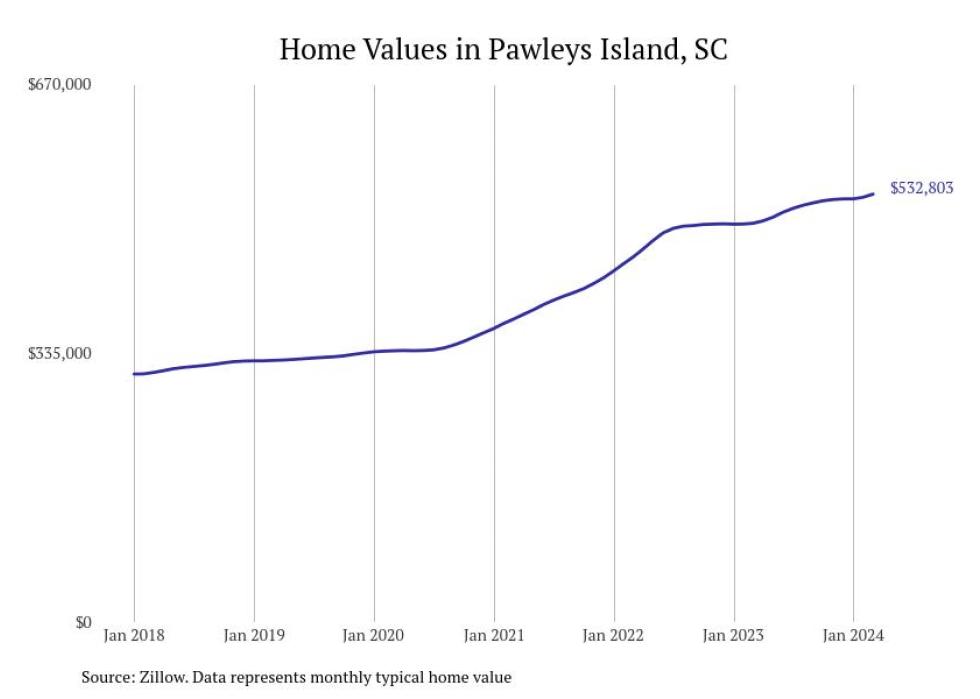
#17. Pawleys Island
- Typical home value: $532,803
- 1-year price change: +7.3%
- 5-year price change: +63.5%
- Metro area: Georgetown, SC
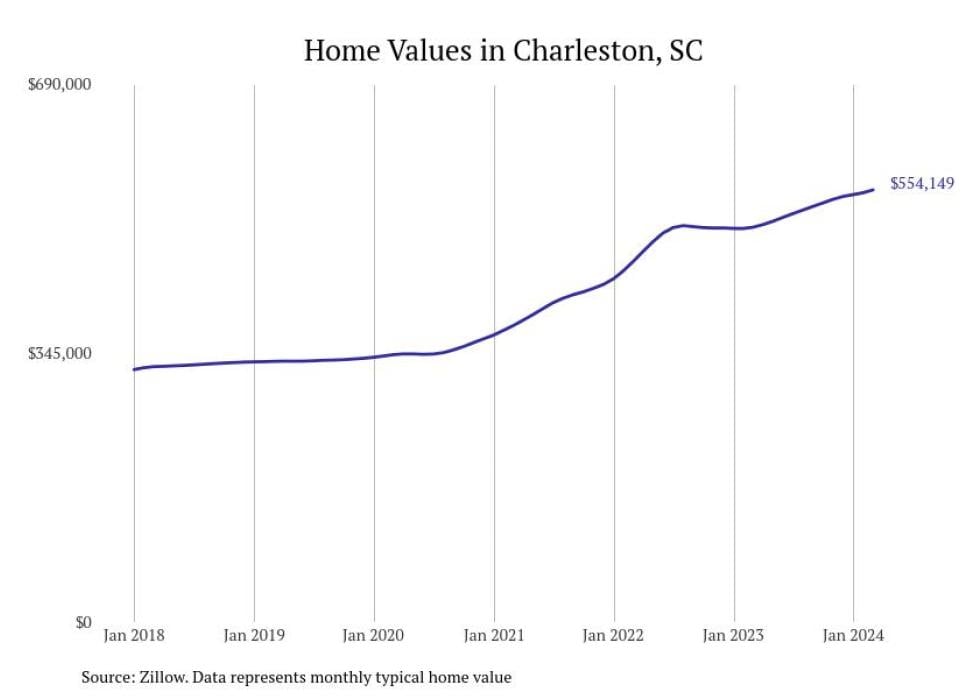
#16. Charleston
- Typical home value: $554,149
- 1-year price change: +9.5%
- 5-year price change: +65.8%
- Metro area: Charleston-North Charleston, SC
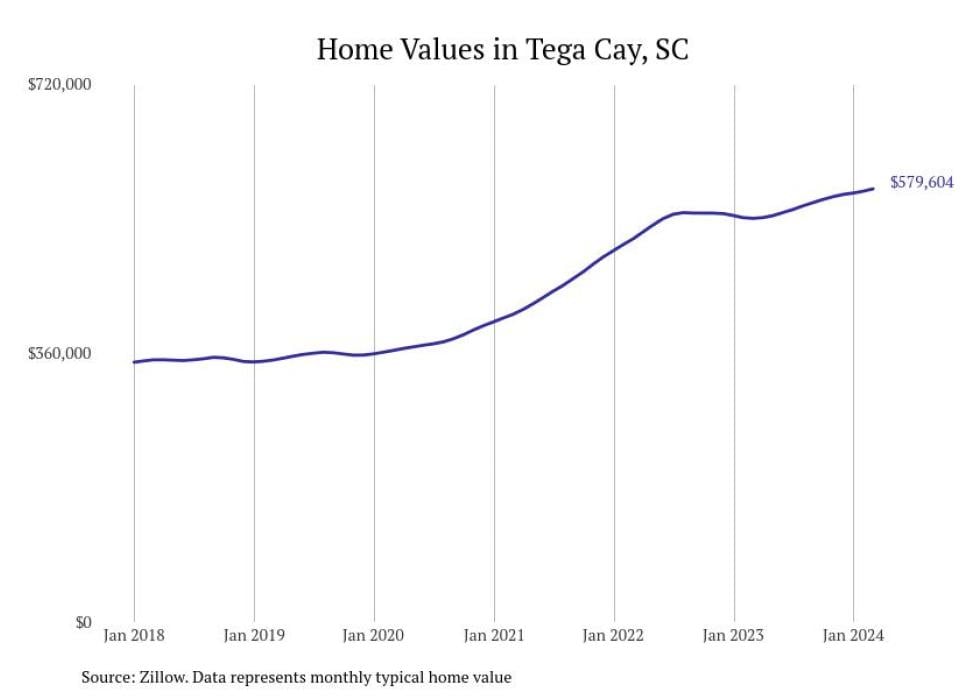
#15. Tega Cay
- Typical home value: $579,604
- 1-year price change: +7.3%
- 5-year price change: +65.3%
- Metro area: Charlotte-Concord-Gastonia, NC-SC
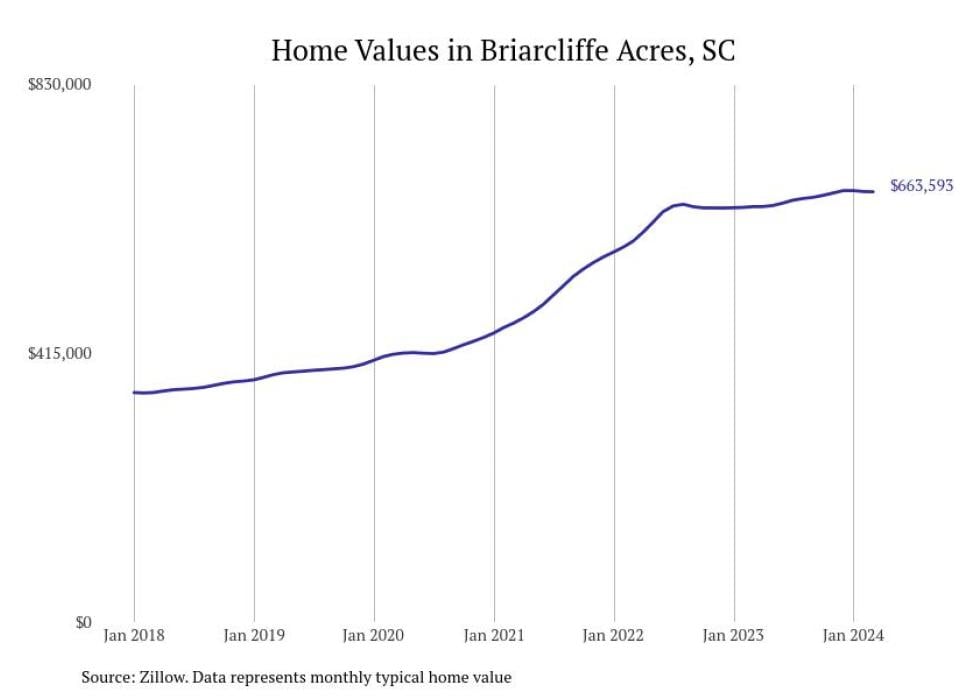
#14. Briarcliffe Acres
- Typical home value: $663,593
- 1-year price change: +3.6%
- 5-year price change: +73.9%
- Metro area: Myrtle Beach-Conway-North Myrtle Beach, SC-NC
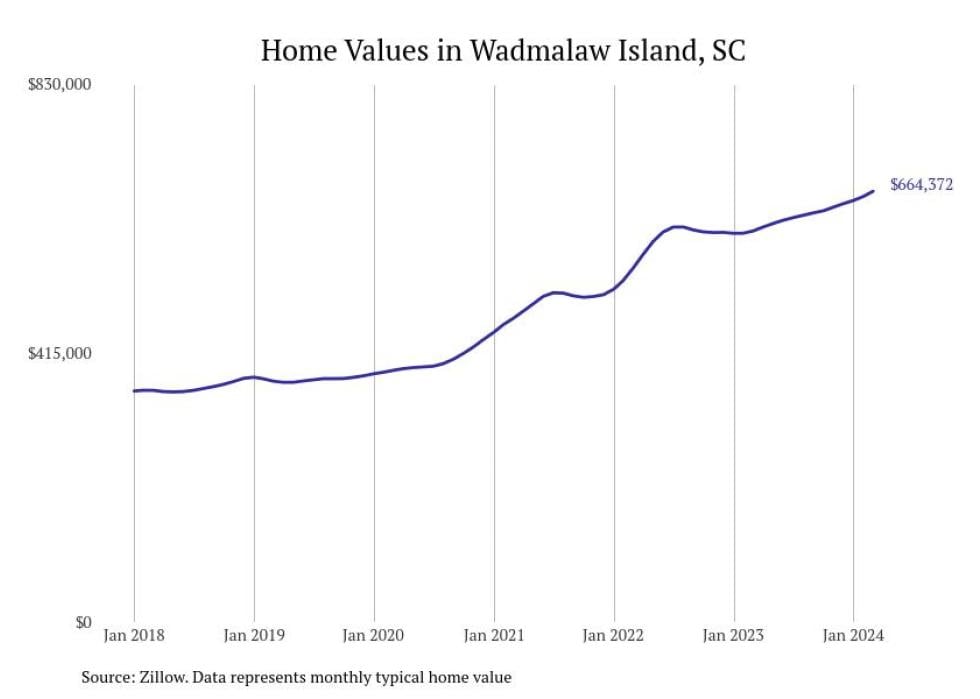
#13. Wadmalaw Island
- Typical home value: $664,372
- 1-year price change: +10.2%
- 5-year price change: +78.8%
- Metro area: Charleston-North Charleston, SC
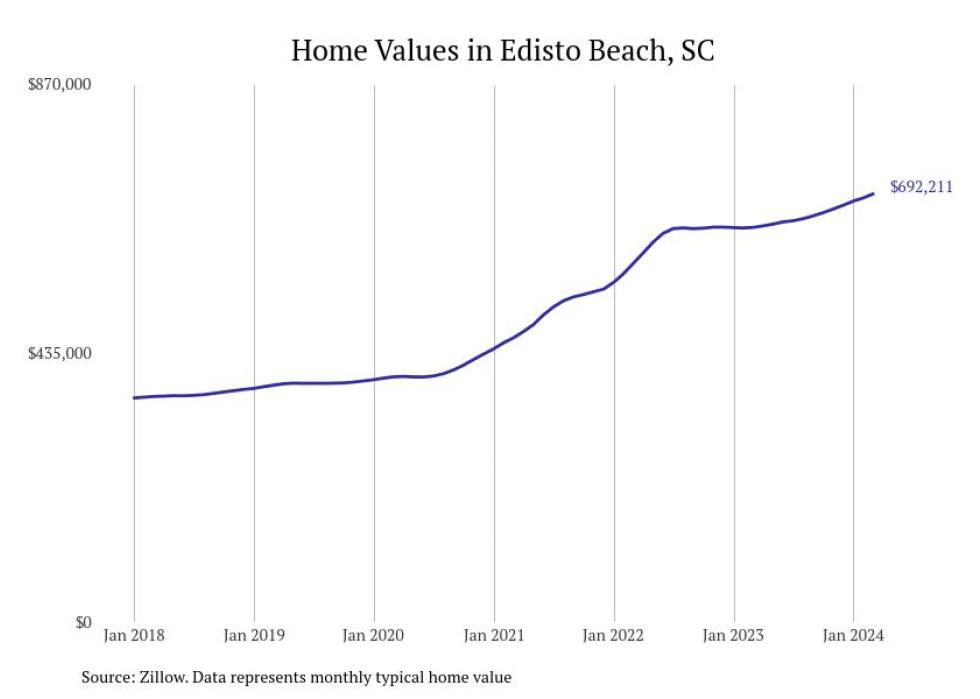
#12. Edisto Beach
- Typical home value: $692,211
- 1-year price change: +8.5%
- 5-year price change: +80.8%
- Metro area: Charleston-North Charleston, SC
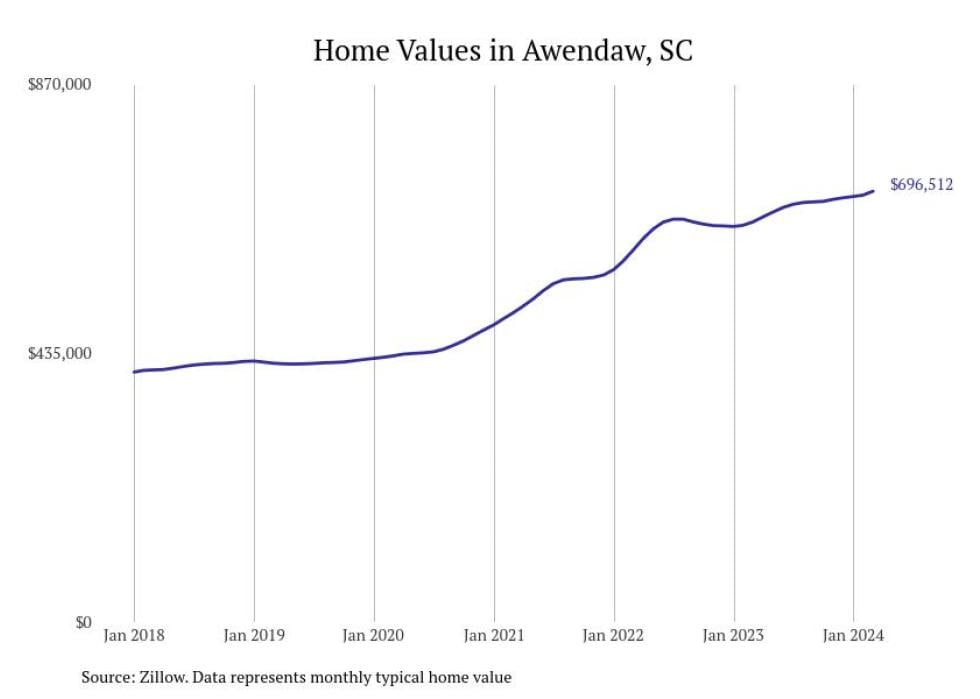
#11. Awendaw
- Typical home value: $696,512
- 1-year price change: +7.7%
- 5-year price change: +66.4%
- Metro area: Charleston-North Charleston, SC
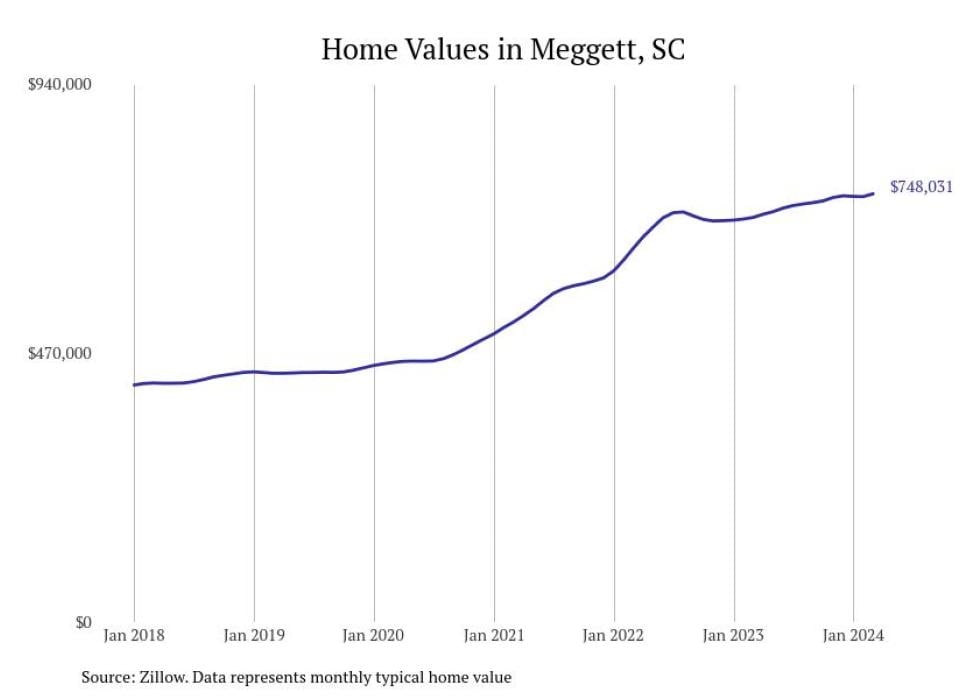
#10. Meggett
- Typical home value: $748,031
- 1-year price change: +5.8%
- 5-year price change: +72.2%
- Metro area: Charleston-North Charleston, SC
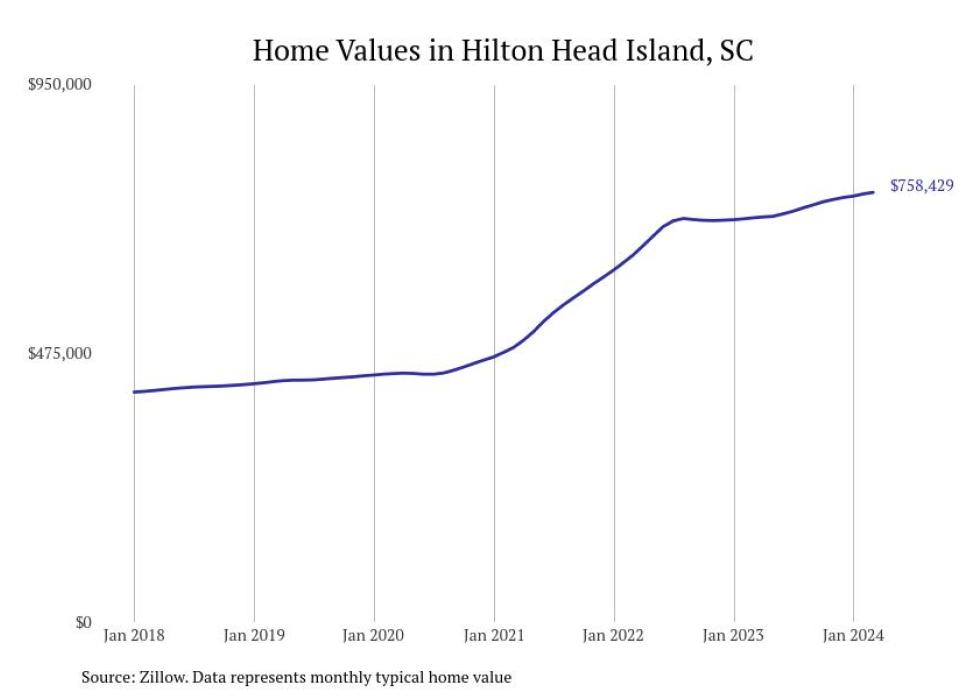
#9. Hilton Head Island
- Typical home value: $758,429
- 1-year price change: +6.3%
- 5-year price change: +78.7%
- Metro area: Hilton Head Island-Bluffton, SC
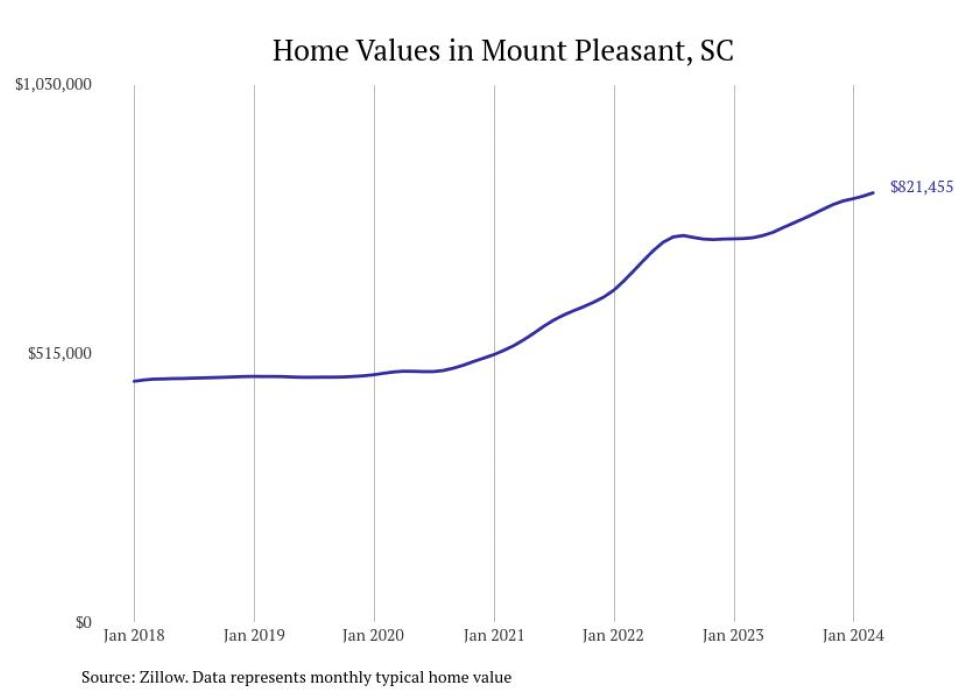
#8. Mount Pleasant
- Typical home value: $821,455
- 1-year price change: +11.7%
- 5-year price change: +74.8%
- Metro area: Charleston-North Charleston, SC
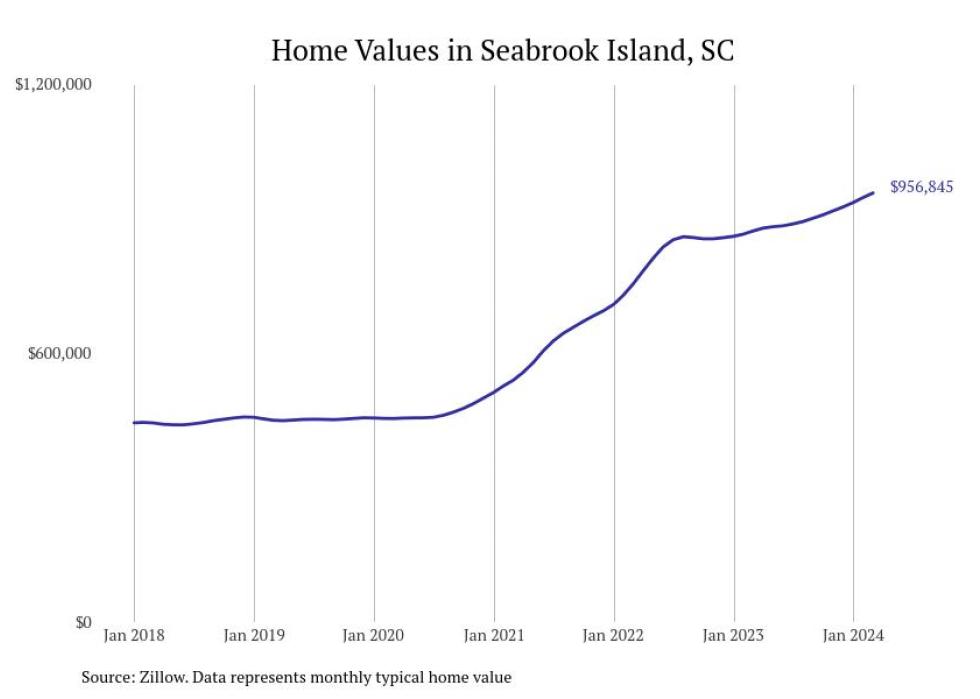
#7. Seabrook Island
- Typical home value: $956,845
- 1-year price change: +9.7%
- 5-year price change: +112.6%
- Metro area: Charleston-North Charleston, SC
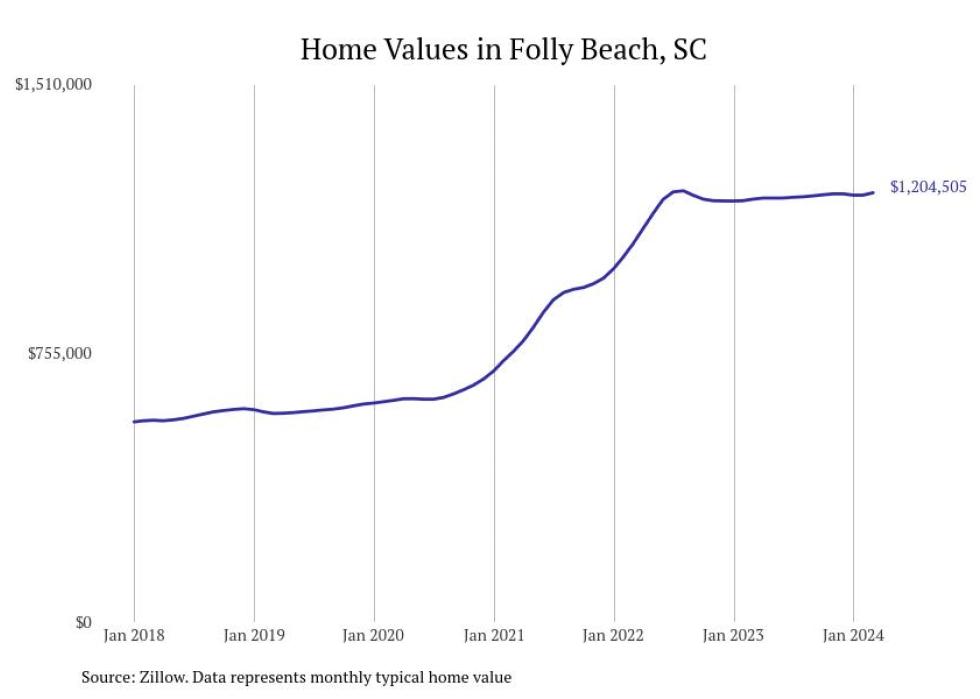
#6. Folly Beach
- Typical home value: $1,204,505
- 1-year price change: +1.5%
- 5-year price change: +105.8%
- Metro area: Charleston-North Charleston, SC
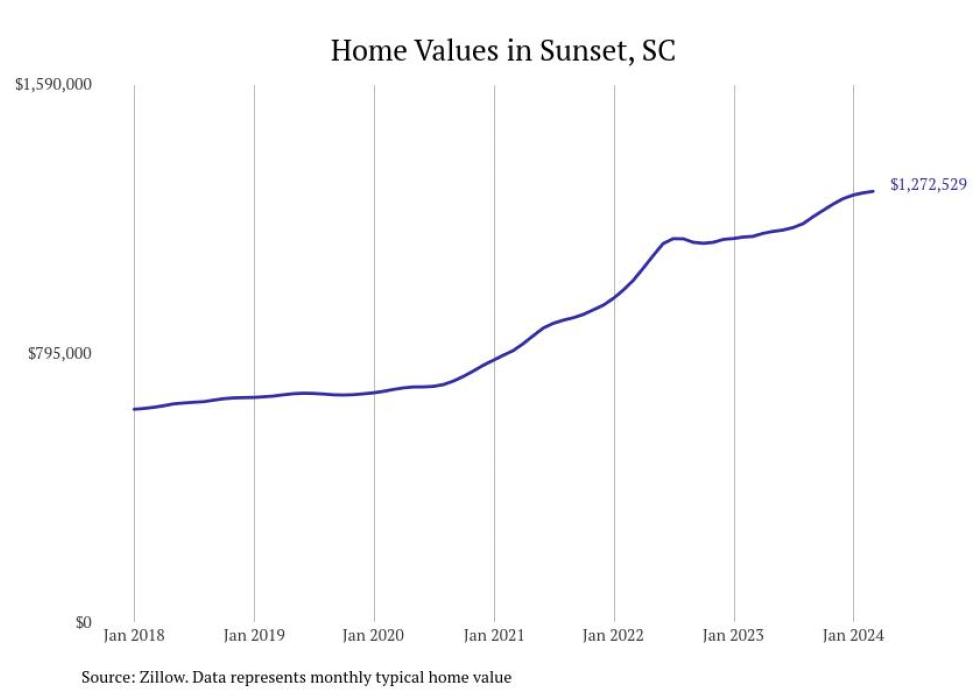
#5. Sunset
- Typical home value: $1,272,529
- 1-year price change: +11.7%
- 5-year price change: +90.6%
- Metro area: Greenville-Anderson, SC
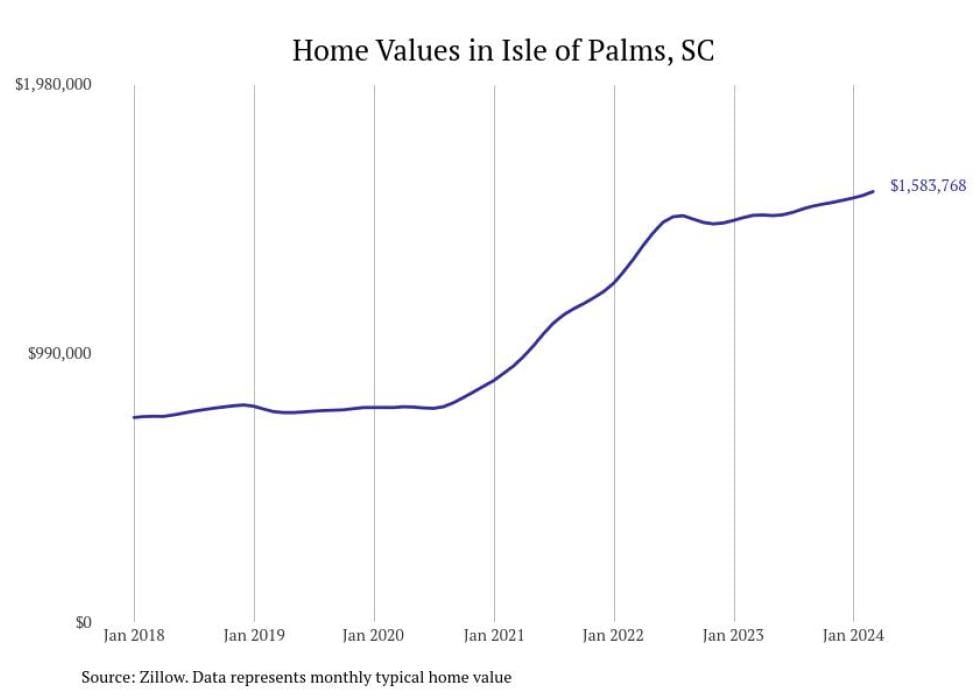
#4. Isle of Palms
- Typical home value: $1,583,768
- 1-year price change: +5.8%
- 5-year price change: +104.5%
- Metro area: Charleston-North Charleston, SC
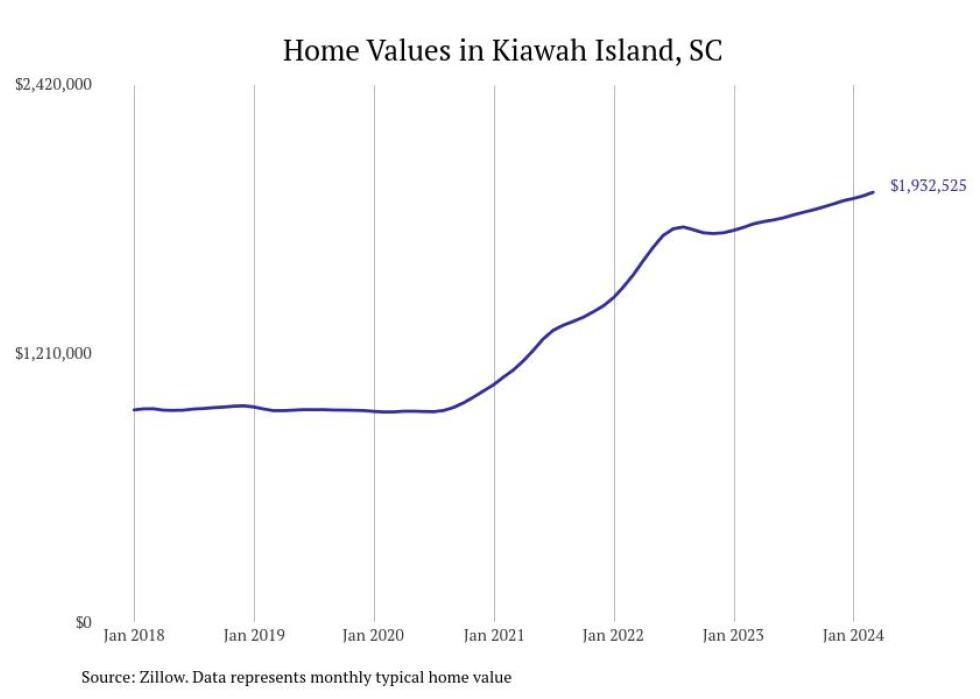
#3. Kiawah Island
- Typical home value: $1,932,525
- 1-year price change: +8.0%
- 5-year price change: +103.2%
- Metro area: Charleston-North Charleston, SC
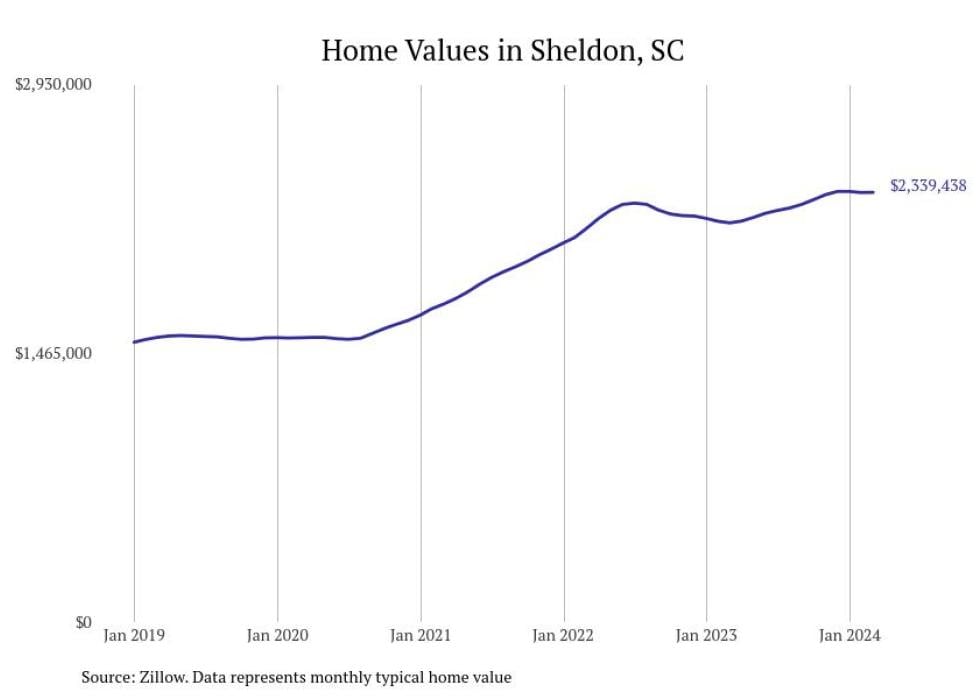
#2. Sheldon
- Typical home value: $2,339,438
- 1-year price change: +7.6%
- 5-year price change: +50.9%
- Metro area: Hilton Head Island-Bluffton, SC
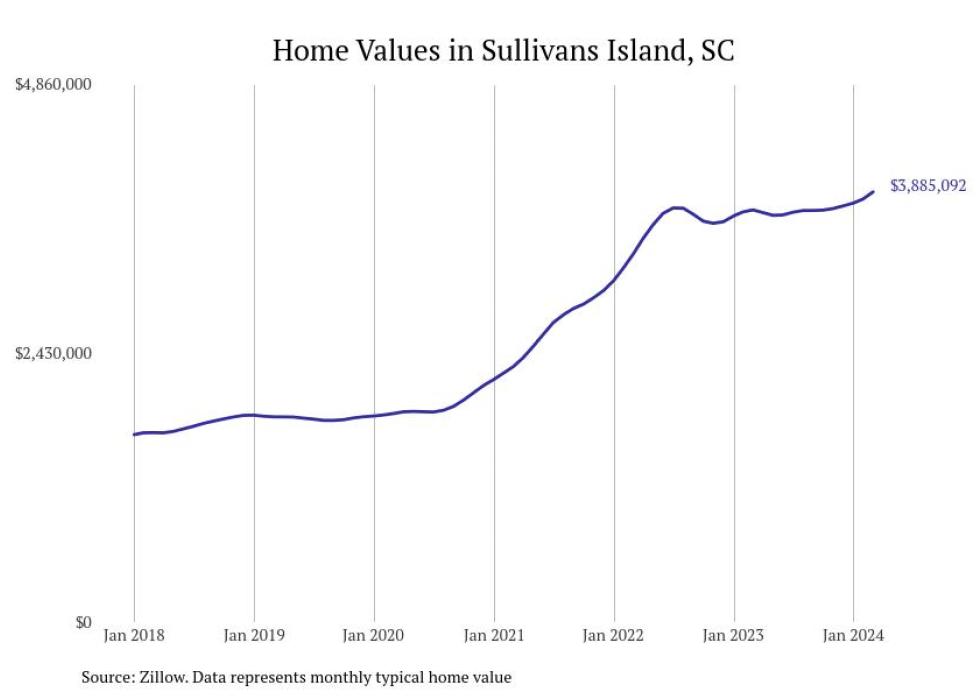
#1. Sullivans Island
- Typical home value: $3,885,092
- 1-year price change: +4.4%
- 5-year price change: +109.6%
- Metro area: Charleston-North Charleston, SC
This story features data reporting and writing by Elena Cox and is part of a series utilizing data automation across 50 states.