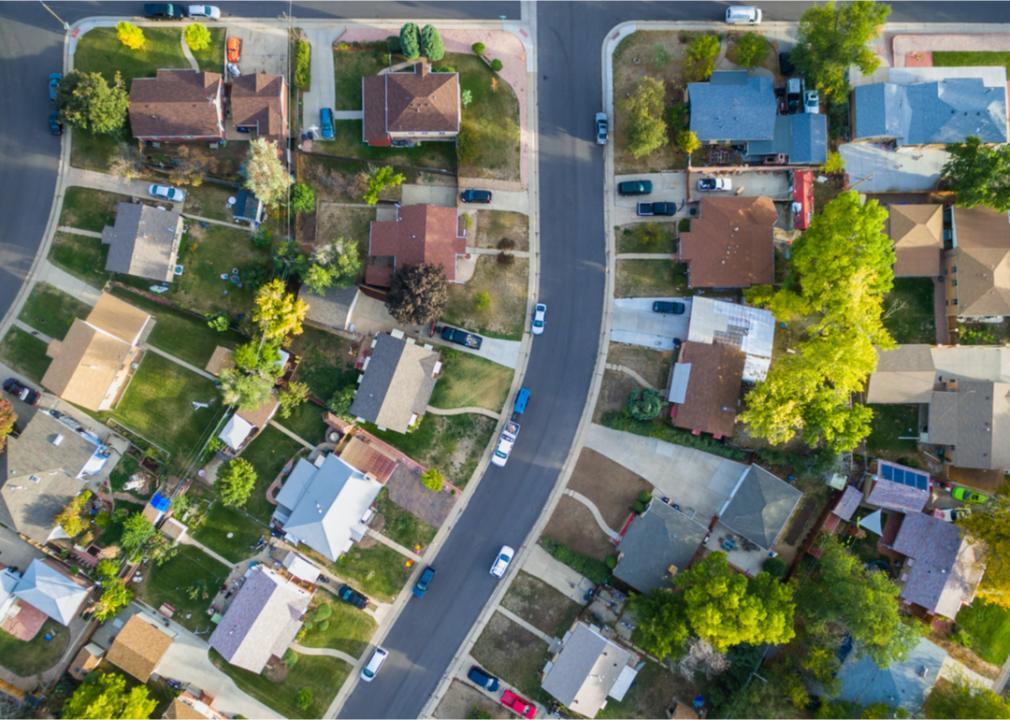
Counties in Pennsylvania where people spend most of their paycheck on housing
Counties in Pennsylvania where people spend most of their paycheck on housing
It's no secret that many Americans are forgoing homeownership in favor of renting. In 2020, renters in the U.S. occupied 43 million housing units.
The Stacker team looked at data from a United States Census survey that revealed an estimated 43,378,800 renter-occupied homes in the United States as of 2017, which makes up 36.1% of all households in the country. In 2019, renting was more affordable than buying a median-priced home in 59% of the counties; in 2021, the opposite was true: Owning was more affordable than renting in 63% of U.S. counties.
Stacker compiled a list of counties in Pennsylvania where people spend the highest percent of income on rent using data from the U.S. Census Bureau. Of course, saving money by owning a home is unattainable for many Americans who don't have savings that could cover a down payment, those who are denied a mortgage, or both. Keep reading to see where in your home state most of people's take-home pay goes to their monthly rent.
You may also like: Counties with the most super commuters in Pennsylvania
#50. Washington County
- Median percent of income spent on housing: 16.0%
--- Percent of households spending <20% of income on housing: 56.5%
--- Percent of households spending >30% of income on housing: 22.0%
- Total occupied households: 84,948
- Median household income: $63,543
- Median monthly housing cost: $849
#49. Clarion County
- Median percent of income spent on housing: 16.1%
--- Percent of households spending <20% of income on housing: 55.4%
--- Percent of households spending >30% of income on housing: 23.3%
- Total occupied households: 16,021
- Median household income: $46,680
- Median monthly housing cost: $627
#48. Crawford County
- Median percent of income spent on housing: 16.2%
--- Percent of households spending <20% of income on housing: 54.8%
--- Percent of households spending >30% of income on housing: 21.9%
- Total occupied households: 35,164
- Median household income: $50,304
- Median monthly housing cost: $678
#47. Butler County
- Median percent of income spent on housing: 16.3%
--- Percent of households spending <20% of income on housing: 55.7%
--- Percent of households spending >30% of income on housing: 21.8%
- Total occupied households: 76,502
- Median household income: $70,668
- Median monthly housing cost: $957
#46. Cambria County
- Median percent of income spent on housing: 16.3%
--- Percent of households spending <20% of income on housing: 55.0%
--- Percent of households spending >30% of income on housing: 22.4%
- Total occupied households: 56,674
- Median household income: $46,659
- Median monthly housing cost: $635
You may also like: Biggest sources of immigrants to Pennsylvania
#45. Mercer County
- Median percent of income spent on housing: 16.4%
--- Percent of households spending <20% of income on housing: 55.4%
--- Percent of households spending >30% of income on housing: 21.4%
- Total occupied households: 46,340
- Median household income: $50,696
- Median monthly housing cost: $693
#44. Schuylkill County
- Median percent of income spent on housing: 16.5%
--- Percent of households spending <20% of income on housing: 53.0%
--- Percent of households spending >30% of income on housing: 24.7%
- Total occupied households: 58,749
- Median household income: $52,280
- Median monthly housing cost: $717
#43. Cameron County
- Median percent of income spent on housing: 16.5%
--- Percent of households spending <20% of income on housing: 56.9%
--- Percent of households spending >30% of income on housing: 22.4%
- Total occupied households: 2,184
- Median household income: $41,165
- Median monthly housing cost: $565
#42. Union County
- Median percent of income spent on housing: 16.6%
--- Percent of households spending <20% of income on housing: 53.6%
--- Percent of households spending >30% of income on housing: 24.2%
- Total occupied households: 14,533
- Median household income: $59,399
- Median monthly housing cost: $822
#41. Northumberland County
- Median percent of income spent on housing: 16.6%
--- Percent of households spending <20% of income on housing: 53.1%
--- Percent of households spending >30% of income on housing: 23.0%
- Total occupied households: 39,075
- Median household income: $48,671
- Median monthly housing cost: $675
You may also like: Highest-earning counties in Pennsylvania
#40. Sullivan County
- Median percent of income spent on housing: 16.7%
--- Percent of households spending <20% of income on housing: 54.9%
--- Percent of households spending >30% of income on housing: 20.4%
- Total occupied households: 2,723
- Median household income: $47,407
- Median monthly housing cost: $658
#39. Beaver County
- Median percent of income spent on housing: 16.7%
--- Percent of households spending <20% of income on housing: 53.4%
--- Percent of households spending >30% of income on housing: 23.7%
- Total occupied households: 71,167
- Median household income: $57,807
- Median monthly housing cost: $803
#38. Potter County
- Median percent of income spent on housing: 16.8%
--- Percent of households spending <20% of income on housing: 52.8%
--- Percent of households spending >30% of income on housing: 23.7%
- Total occupied households: 6,480
- Median household income: $45,419
- Median monthly housing cost: $636
#37. Fayette County
- Median percent of income spent on housing: 16.8%
--- Percent of households spending <20% of income on housing: 53.8%
--- Percent of households spending >30% of income on housing: 24.4%
- Total occupied households: 54,837
- Median household income: $47,364
- Median monthly housing cost: $664
#36. Tioga County
- Median percent of income spent on housing: 16.8%
--- Percent of households spending <20% of income on housing: 51.4%
--- Percent of households spending >30% of income on housing: 25.3%
- Total occupied households: 16,310
- Median household income: $51,324
- Median monthly housing cost: $720
You may also like: Most popular girl names in the 80s in Pennsylvania
#35. Bradford County
- Median percent of income spent on housing: 16.8%
--- Percent of households spending <20% of income on housing: 54.2%
--- Percent of households spending >30% of income on housing: 23.4%
- Total occupied households: 25,021
- Median household income: $52,358
- Median monthly housing cost: $735
#34. Wyoming County
- Median percent of income spent on housing: 17.0%
--- Percent of households spending <20% of income on housing: 51.9%
--- Percent of households spending >30% of income on housing: 23.8%
- Total occupied households: 10,790
- Median household income: $59,415
- Median monthly housing cost: $840
#33. Susquehanna County
- Median percent of income spent on housing: 17.0%
--- Percent of households spending <20% of income on housing: 52.5%
--- Percent of households spending >30% of income on housing: 24.6%
- Total occupied households: 17,235
- Median household income: $54,966
- Median monthly housing cost: $778
#32. Perry County
- Median percent of income spent on housing: 17.1%
--- Percent of households spending <20% of income on housing: 52.0%
--- Percent of households spending >30% of income on housing: 22.5%
- Total occupied households: 18,231
- Median household income: $63,718
- Median monthly housing cost: $906
#31. Mifflin County
- Median percent of income spent on housing: 17.1%
--- Percent of households spending <20% of income on housing: 52.5%
--- Percent of households spending >30% of income on housing: 23.8%
- Total occupied households: 19,043
- Median household income: $50,219
- Median monthly housing cost: $716
You may also like: Counties with the worst commutes in Pennsylvania
#30. Indiana County
- Median percent of income spent on housing: 17.2%
--- Percent of households spending <20% of income on housing: 53.9%
--- Percent of households spending >30% of income on housing: 25.8%
- Total occupied households: 33,246
- Median household income: $49,320
- Median monthly housing cost: $706
#29. Lawrence County
- Median percent of income spent on housing: 17.4%
--- Percent of households spending <20% of income on housing: 52.0%
--- Percent of households spending >30% of income on housing: 25.7%
- Total occupied households: 37,055
- Median household income: $50,204
- Median monthly housing cost: $730
#28. Blair County
- Median percent of income spent on housing: 17.8%
--- Percent of households spending <20% of income on housing: 52.2%
--- Percent of households spending >30% of income on housing: 25.0%
- Total occupied households: 52,126
- Median household income: $49,181
- Median monthly housing cost: $729
#27. Franklin County
- Median percent of income spent on housing: 17.8%
--- Percent of households spending <20% of income on housing: 51.6%
--- Percent of households spending >30% of income on housing: 23.5%
- Total occupied households: 60,438
- Median household income: $63,379
- Median monthly housing cost: $940
#26. Clinton County
- Median percent of income spent on housing: 17.9%
--- Percent of households spending <20% of income on housing: 50.5%
--- Percent of households spending >30% of income on housing: 25.7%
- Total occupied households: 14,690
- Median household income: $50,923
- Median monthly housing cost: $759
You may also like: Highest-rated specialty museums in Pennsylvania, according to Tripadvisor
#25. Cumberland County
- Median percent of income spent on housing: 18.2%
--- Percent of households spending <20% of income on housing: 51.4%
--- Percent of households spending >30% of income on housing: 24.7%
- Total occupied households: 99,804
- Median household income: $71,269
- Median monthly housing cost: $1,082
#24. Luzerne County
- Median percent of income spent on housing: 18.4%
--- Percent of households spending <20% of income on housing: 50.0%
--- Percent of households spending >30% of income on housing: 25.8%
- Total occupied households: 128,660
- Median household income: $53,473
- Median monthly housing cost: $818
#23. Allegheny County
- Median percent of income spent on housing: 18.5%
--- Percent of households spending <20% of income on housing: 51.2%
--- Percent of households spending >30% of income on housing: 26.0%
- Total occupied households: 541,541
- Median household income: $61,043
- Median monthly housing cost: $939
#22. Columbia County
- Median percent of income spent on housing: 18.5%
--- Percent of households spending <20% of income on housing: 49.6%
--- Percent of households spending >30% of income on housing: 25.7%
- Total occupied households: 26,372
- Median household income: $50,550
- Median monthly housing cost: $778
#21. Lebanon County
- Median percent of income spent on housing: 18.5%
--- Percent of households spending <20% of income on housing: 49.3%
--- Percent of households spending >30% of income on housing: 27.4%
- Total occupied households: 53,579
- Median household income: $60,281
- Median monthly housing cost: $928
You may also like: Counties with the most college graduates in Pennsylvania
#20. Lycoming County
- Median percent of income spent on housing: 18.5%
--- Percent of households spending <20% of income on housing: 49.8%
--- Percent of households spending >30% of income on housing: 28.3%
- Total occupied households: 45,608
- Median household income: $54,241
- Median monthly housing cost: $836
#19. Carbon County
- Median percent of income spent on housing: 18.5%
--- Percent of households spending <20% of income on housing: 48.6%
--- Percent of households spending >30% of income on housing: 27.0%
- Total occupied households: 26,043
- Median household income: $57,006
- Median monthly housing cost: $881
#18. Erie County
- Median percent of income spent on housing: 18.6%
--- Percent of households spending <20% of income on housing: 49.1%
--- Percent of households spending >30% of income on housing: 26.5%
- Total occupied households: 110,318
- Median household income: $51,529
- Median monthly housing cost: $799
#17. Wayne County
- Median percent of income spent on housing: 18.7%
--- Percent of households spending <20% of income on housing: 48.2%
--- Percent of households spending >30% of income on housing: 26.1%
- Total occupied households: 18,841
- Median household income: $56,096
- Median monthly housing cost: $872
#16. Adams County
- Median percent of income spent on housing: 18.8%
--- Percent of households spending <20% of income on housing: 46.6%
--- Percent of households spending >30% of income on housing: 25.5%
- Total occupied households: 39,345
- Median household income: $67,253
- Median monthly housing cost: $1,052
You may also like: Fastest-growing counties in Pennsylvania
#15. Lackawanna County
- Median percent of income spent on housing: 19.2%
--- Percent of households spending <20% of income on housing: 46.6%
--- Percent of households spending >30% of income on housing: 29.2%
- Total occupied households: 87,161
- Median household income: $52,821
- Median monthly housing cost: $846
#14. Chester County
- Median percent of income spent on housing: 19.5%
--- Percent of households spending <20% of income on housing: 47.9%
--- Percent of households spending >30% of income on housing: 27.1%
- Total occupied households: 190,980
- Median household income: $100,214
- Median monthly housing cost: $1,626
#13. York County
- Median percent of income spent on housing: 19.6%
--- Percent of households spending <20% of income on housing: 46.6%
--- Percent of households spending >30% of income on housing: 27.5%
- Total occupied households: 172,421
- Median household income: $66,457
- Median monthly housing cost: $1,088
#12. Lancaster County
- Median percent of income spent on housing: 19.7%
--- Percent of households spending <20% of income on housing: 46.7%
--- Percent of households spending >30% of income on housing: 28.7%
- Total occupied households: 201,620
- Median household income: $66,056
- Median monthly housing cost: $1,085
#11. Dauphin County
- Median percent of income spent on housing: 19.7%
--- Percent of households spending <20% of income on housing: 47.5%
--- Percent of households spending >30% of income on housing: 27.6%
- Total occupied households: 112,212
- Median household income: $60,715
- Median monthly housing cost: $999
You may also like: Best counties to raise a family in Pennsylvania
#10. Montgomery County
- Median percent of income spent on housing: 20.0%
--- Percent of households spending <20% of income on housing: 47.1%
--- Percent of households spending >30% of income on housing: 28.5%
- Total occupied households: 316,206
- Median household income: $91,546
- Median monthly housing cost: $1,522
#9. Berks County
- Median percent of income spent on housing: 20.3%
--- Percent of households spending <20% of income on housing: 44.8%
--- Percent of households spending >30% of income on housing: 29.5%
- Total occupied households: 154,712
- Median household income: $63,728
- Median monthly housing cost: $1,079
#8. Bucks County
- Median percent of income spent on housing: 20.5%
--- Percent of households spending <20% of income on housing: 44.5%
--- Percent of households spending >30% of income on housing: 30.6%
- Total occupied households: 238,830
- Median household income: $89,139
- Median monthly housing cost: $1,523
#7. Delaware County
- Median percent of income spent on housing: 20.6%
--- Percent of households spending <20% of income on housing: 43.8%
--- Percent of households spending >30% of income on housing: 31.6%
- Total occupied households: 207,257
- Median household income: $74,477
- Median monthly housing cost: $1,278
#6. Centre County
- Median percent of income spent on housing: 20.8%
--- Percent of households spending <20% of income on housing: 44.9%
--- Percent of households spending >30% of income on housing: 30.8%
- Total occupied households: 58,201
- Median household income: $60,403
- Median monthly housing cost: $1,045
You may also like: Most popular boy names in the 60s in Pennsylvania
#5. Northampton County
- Median percent of income spent on housing: 20.8%
--- Percent of households spending <20% of income on housing: 43.5%
--- Percent of households spending >30% of income on housing: 30.5%
- Total occupied households: 114,185
- Median household income: $70,471
- Median monthly housing cost: $1,222
#4. Pike County
- Median percent of income spent on housing: 21.6%
--- Percent of households spending <20% of income on housing: 45.1%
--- Percent of households spending >30% of income on housing: 32.1%
- Total occupied households: 22,119
- Median household income: $65,928
- Median monthly housing cost: $1,184
#3. Lehigh County
- Median percent of income spent on housing: 21.6%
--- Percent of households spending <20% of income on housing: 42.7%
--- Percent of households spending >30% of income on housing: 32.0%
- Total occupied households: 138,714
- Median household income: $63,897
- Median monthly housing cost: $1,152
#2. Monroe County
- Median percent of income spent on housing: 23.3%
--- Percent of households spending <20% of income on housing: 40.6%
--- Percent of households spending >30% of income on housing: 35.1%
- Total occupied households: 57,098
- Median household income: $63,934
- Median monthly housing cost: $1,241
#1. Philadelphia County
- Median percent of income spent on housing: 26.0%
--- Percent of households spending <20% of income on housing: 37.6%
--- Percent of households spending >30% of income on housing: 38.0%
- Total occupied households: 601,337
- Median household income: $45,927
- Median monthly housing cost: $994
You may also like: Most popular boy names in the 70s in Pennsylvania