Counties with the most bridges in dire need of repair in Oregon
Counties with the most bridges in dire need of repair in Oregon
One in three U.S. bridges is in need of repair or replacement, according to data from the American Road & Transportation Builders Association, including 29% of interstate bridges. The cost to make these repairs is estimated to be in excess of $54 billion.
Stacker investigated which counties in Oregon have the most bridges in dire need of repair using data from the Federal Highway Administration. The data is accurate as of June 15, 2022. Counties are ranked by percent of bridges in "poor" condition and ties are broken by percent square meters of bridges in poor condition. Counties that have no bridges or have no bridges in poor condition are excluded from the list.

#20. Marion County
- Bridges in poor condition: 3.8% (14 of 371 bridges)
- Square meters of bridges in poor condition: 1.6% (4,165 of 265,461 square meters of bridges)

#19. Clackamas County
- Bridges in poor condition: 3.9% (14 of 363 bridges)
- Square meters of bridges in poor condition: 1.7% (4,708 of 282,265 square meters of bridges)
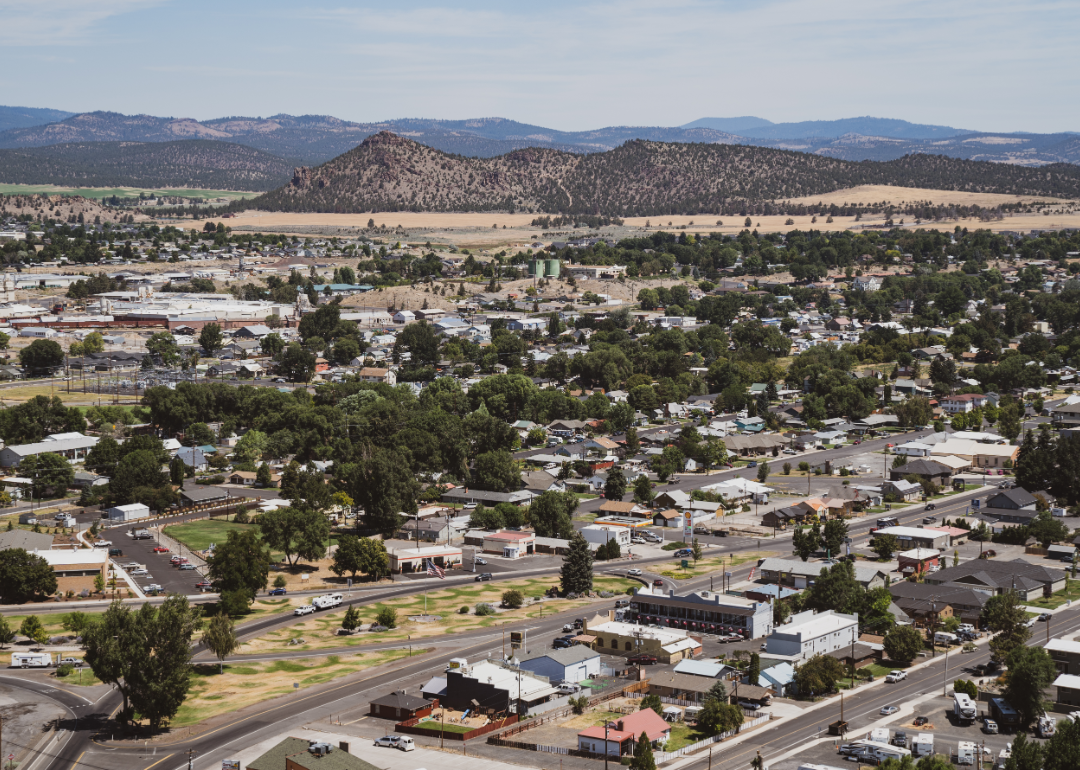
#18. Crook County
- Bridges in poor condition: 4.0% (3 of 75 bridges)
- Square meters of bridges in poor condition: 1.9% (299 of 15,371 square meters of bridges)

#17. Curry County
- Bridges in poor condition: 4.0% (4 of 100 bridges)
- Square meters of bridges in poor condition: 3.1% (2,039 of 65,533 square meters of bridges)
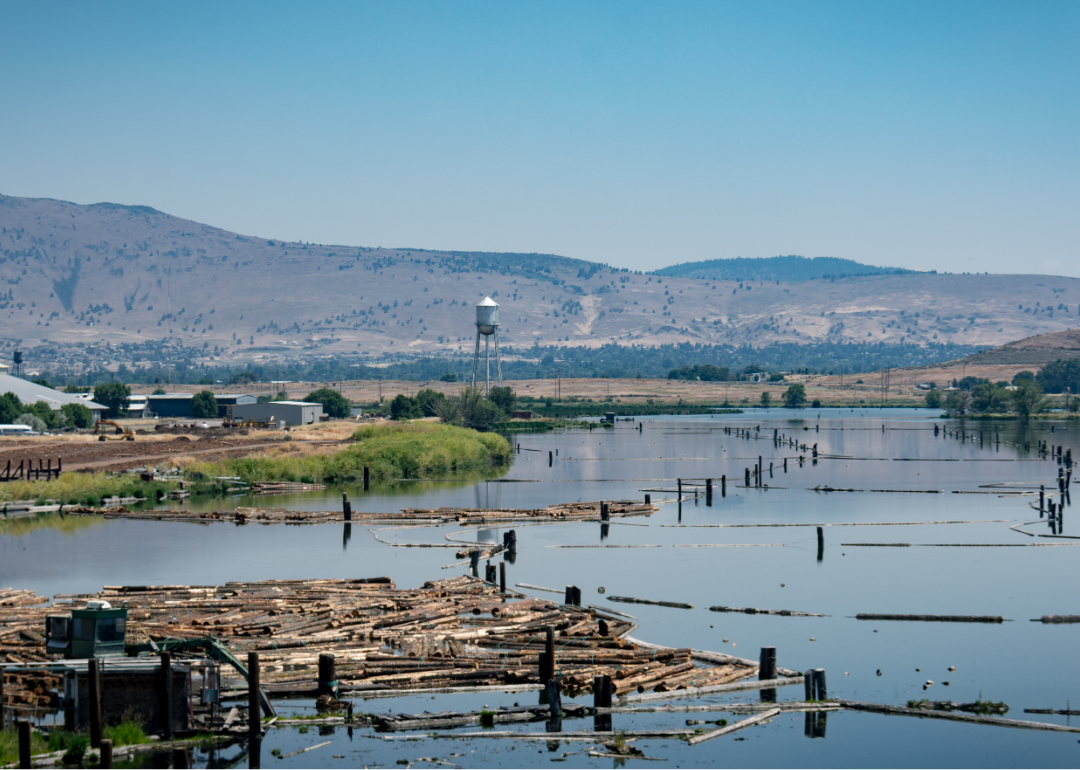
#16. Klamath County
- Bridges in poor condition: 4.4% (11 of 249 bridges)
- Square meters of bridges in poor condition: 1.7% (1,692 of 101,991 square meters of bridges)
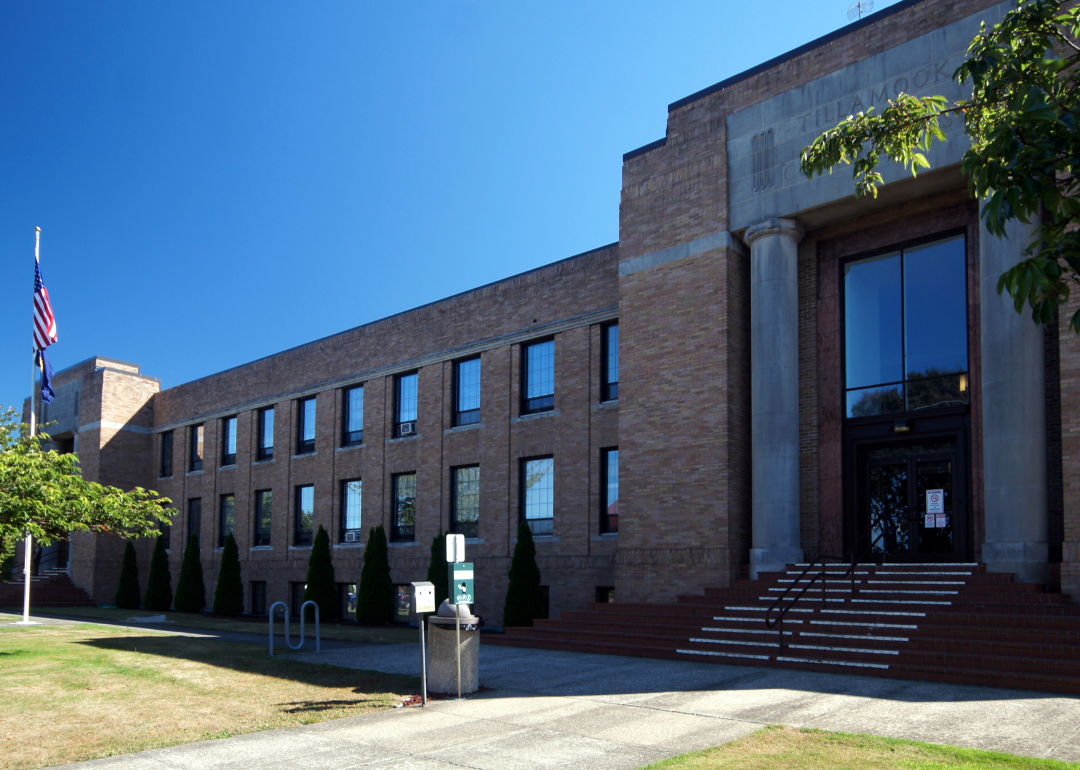
#15. Tillamook County
- Bridges in poor condition: 4.7% (10 of 214 bridges)
- Square meters of bridges in poor condition: 2.6% (2,152 of 84,315 square meters of bridges)

#14. Columbia County
- Bridges in poor condition: 4.8% (6 of 126 bridges)
- Square meters of bridges in poor condition: 3.4% (1,905 of 56,068 square meters of bridges)
#13. Benton County
- Bridges in poor condition: 4.8% (9 of 187 bridges)
- Square meters of bridges in poor condition: 4.6% (3,375 of 73,084 square meters of bridges)

#12. Yamhill County
- Bridges in poor condition: 5.4% (8 of 149 bridges)
- Square meters of bridges in poor condition: 5.1% (4,906 of 97,112 square meters of bridges)

#11. Lake County
- Bridges in poor condition: 5.5% (5 of 91 bridges)
- Square meters of bridges in poor condition: 2.2% (318 of 14,257 square meters of bridges)
#10. Polk County
- Bridges in poor condition: 6.2% (10 of 161 bridges)
- Square meters of bridges in poor condition: 3.7% (2,201 of 58,846 square meters of bridges)

#9. Grant County
- Bridges in poor condition: 6.3% (9 of 143 bridges)
- Square meters of bridges in poor condition: 3.3% (1,026 of 31,545 square meters of bridges)
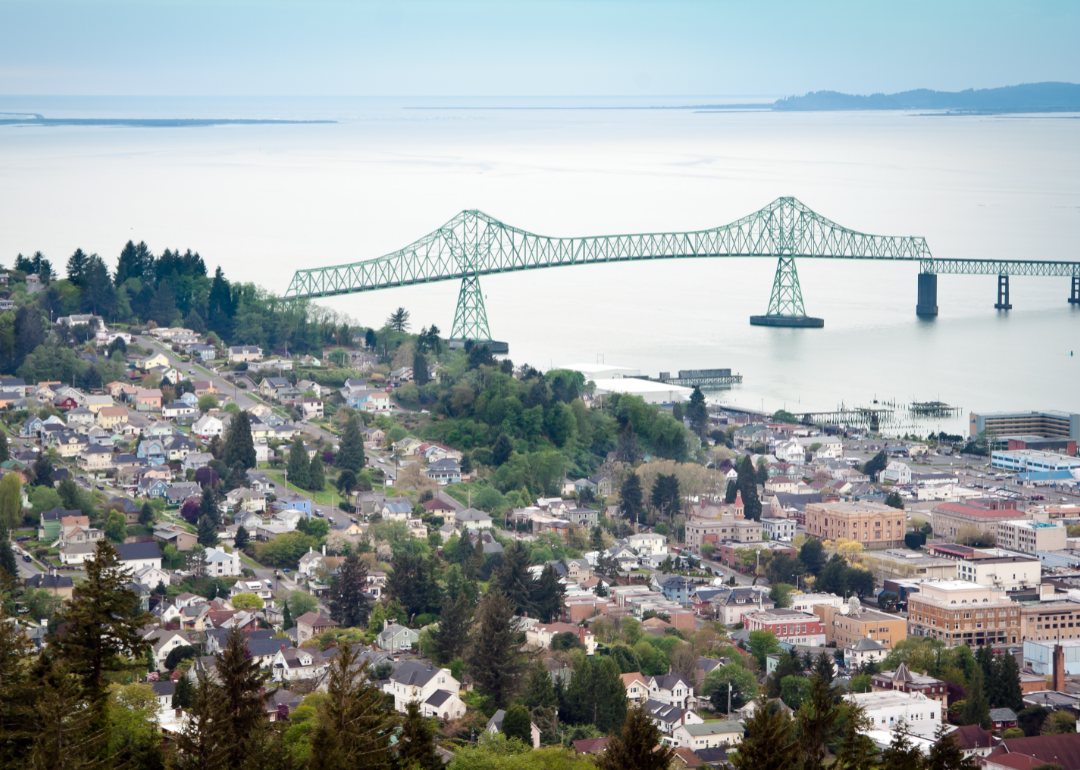
#8. Clatsop County
- Bridges in poor condition: 6.4% (10 of 156 bridges)
- Square meters of bridges in poor condition: 6.3% (10,351 of 164,872 square meters of bridges)

#7. Umatilla County
- Bridges in poor condition: 6.4% (21 of 326 bridges)
- Square meters of bridges in poor condition: 2.8% (4,608 of 163,909 square meters of bridges)
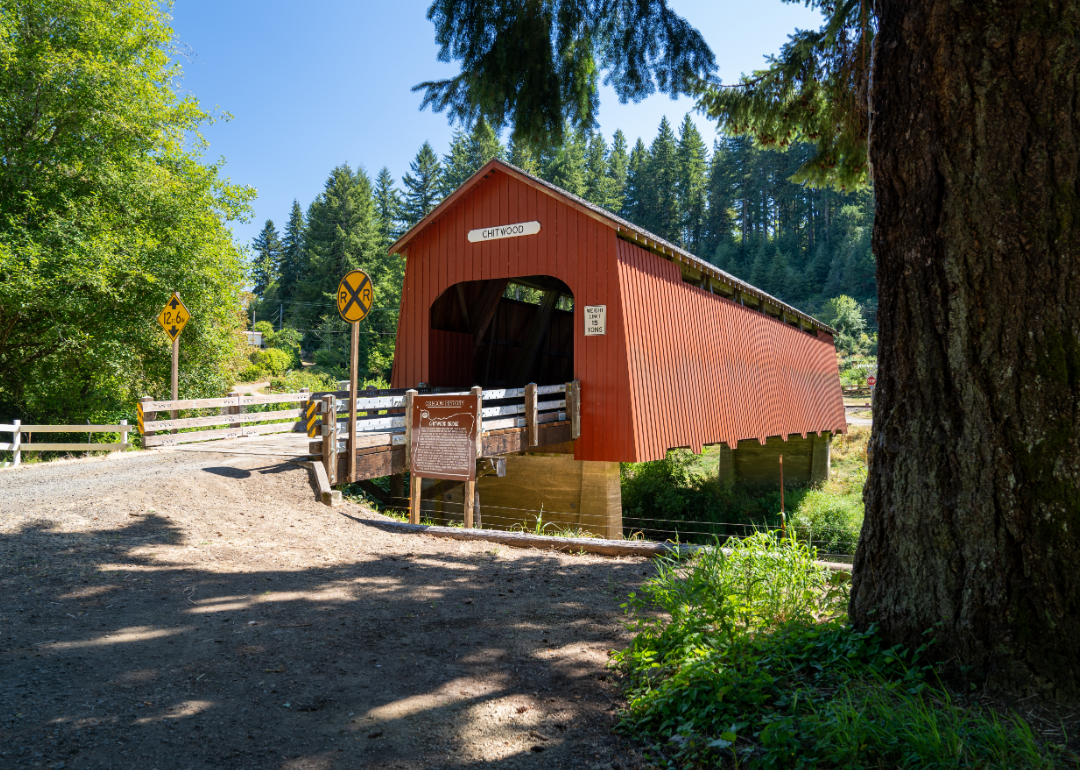
#6. Lincoln County
- Bridges in poor condition: 6.9% (13 of 189 bridges)
- Square meters of bridges in poor condition: 6.0% (6,554 of 108,565 square meters of bridges)
#5. Jefferson County
- Bridges in poor condition: 7.9% (6 of 76 bridges)
- Square meters of bridges in poor condition: 3.8% (813 of 21,351 square meters of bridges)
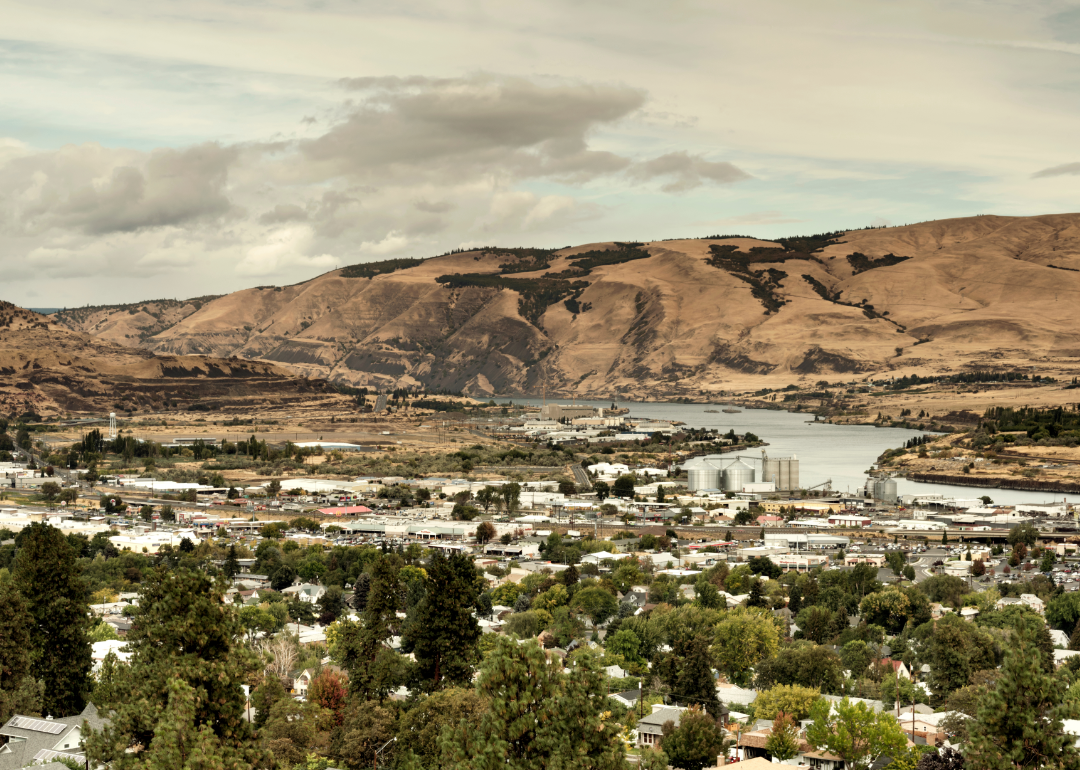
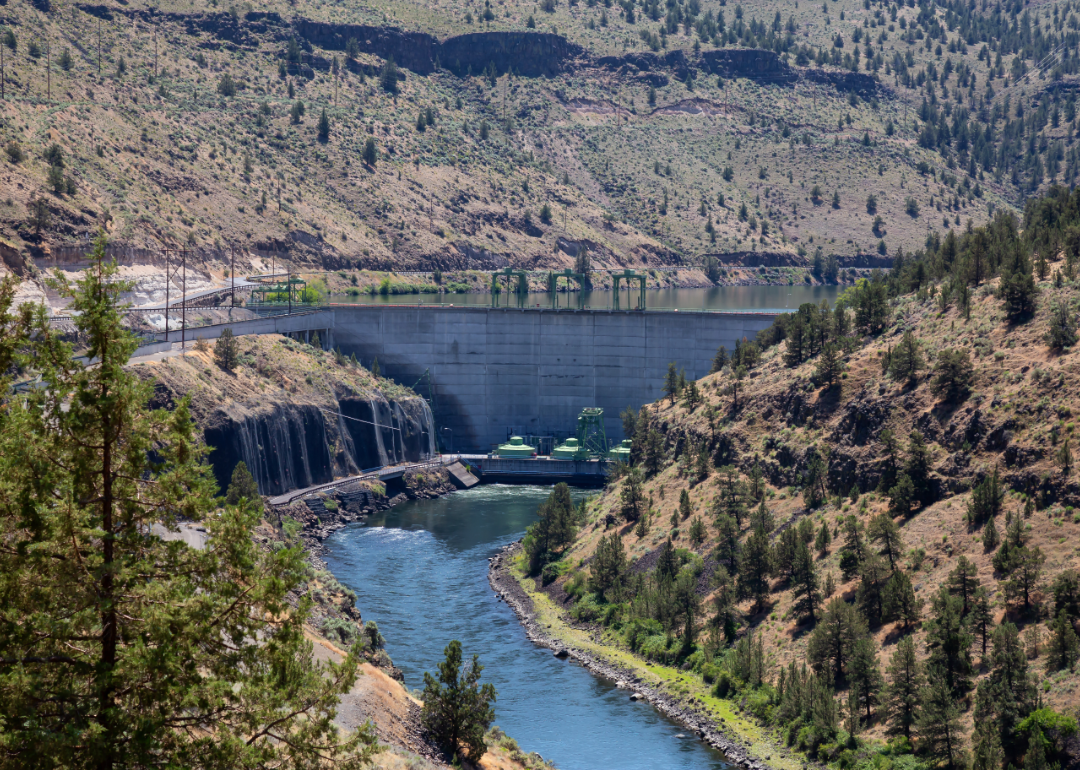
#4. Wasco County
- Bridges in poor condition: 8.0% (12 of 150 bridges)
- Square meters of bridges in poor condition: 13.4% (11,334 of 84,559 square meters of bridges)
#3. Wallowa County
- Bridges in poor condition: 8.2% (9 of 110 bridges)
- Square meters of bridges in poor condition: 4.9% (966 of 19,893 square meters of bridges)

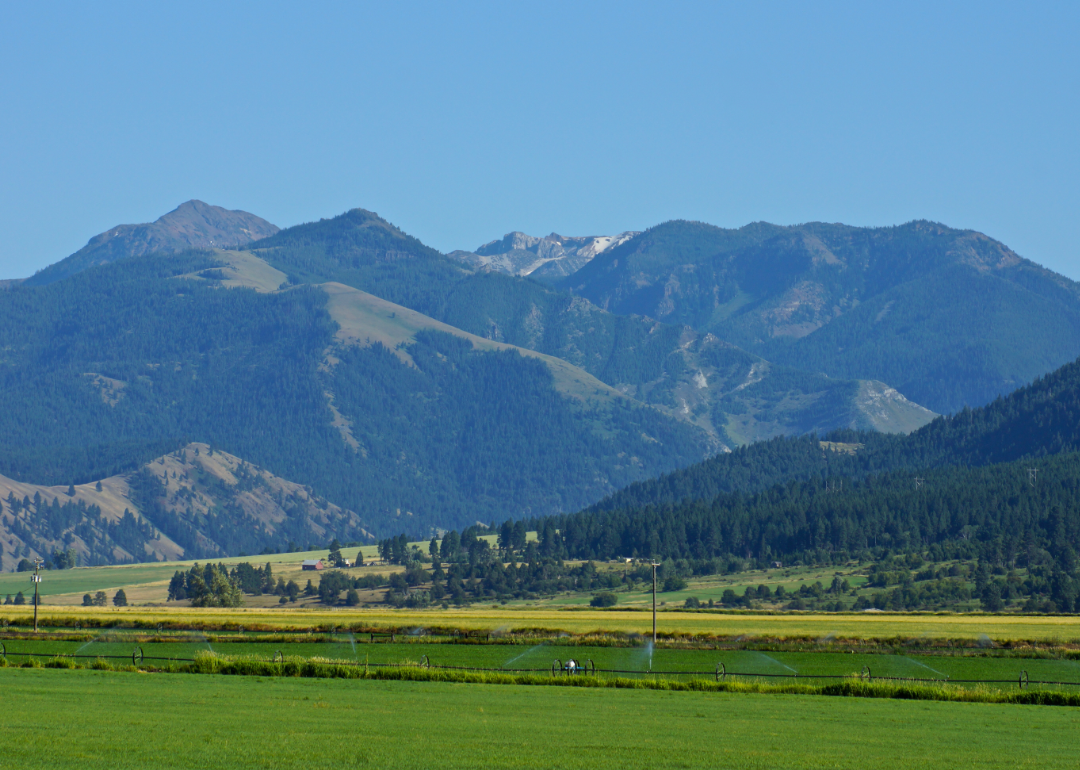
#2. Baker County
- Bridges in poor condition: 8.5% (16 of 188 bridges)
- Square meters of bridges in poor condition: 3.6% (2,790 of 77,572 square meters of bridges)
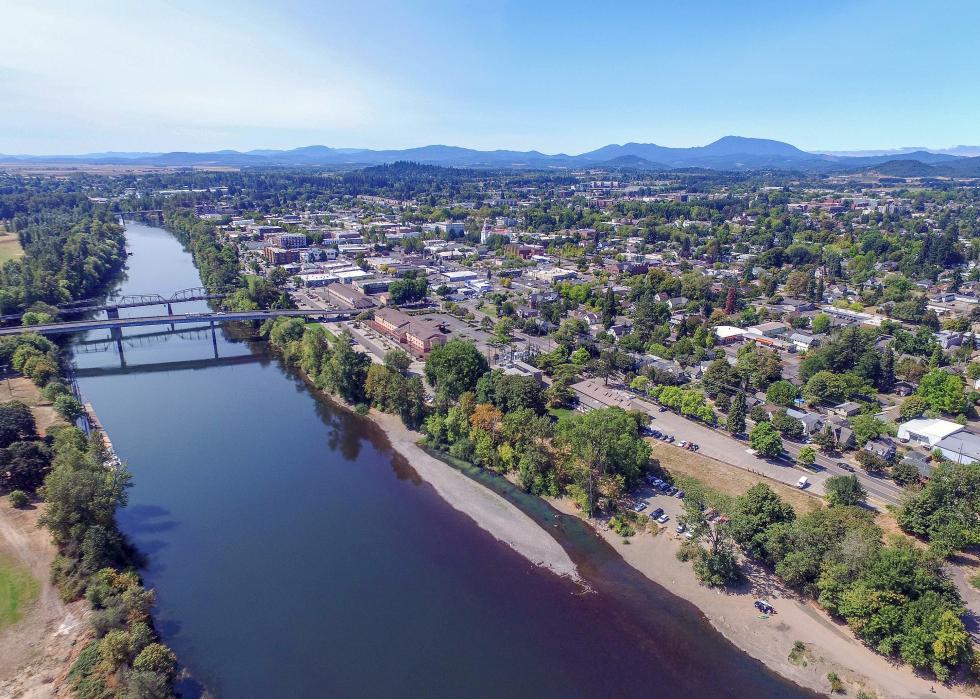
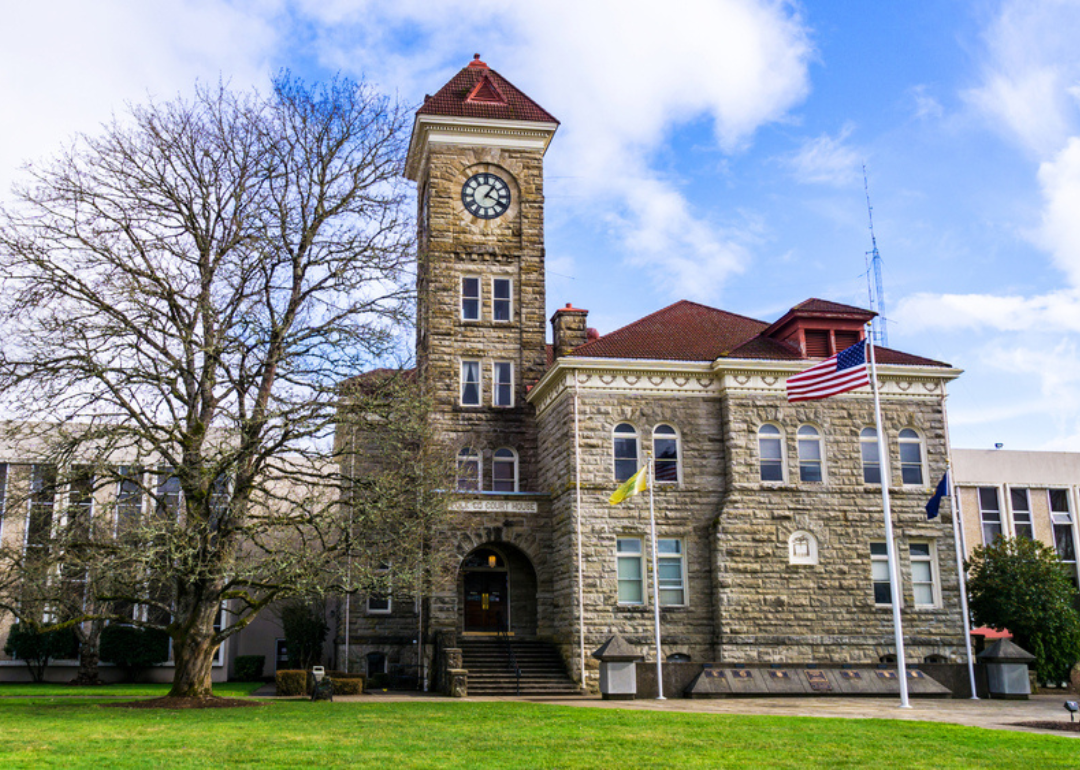
#1. Linn County
- Bridges in poor condition: 17.5% (99 of 565 bridges)
- Square meters of bridges in poor condition: 10.1% (20,906 of 207,565 square meters of bridges)


