Counties with the most bridges in dire need of repair in New Jersey
Counties with the most bridges in dire need of repair in New Jersey
One in three U.S. bridges is in need of repair or replacement, according to data from the American Road & Transportation Builders Association, including 29% of interstate bridges. The cost to make these repairs is estimated to be in excess of $54 billion.
Stacker investigated which counties in New Jersey have the most bridges in dire need of repair using data from the Federal Highway Administration. The data is accurate as of June 15, 2022. Counties are ranked by percent of bridges in "poor" condition and ties are broken by percent square meters of bridges in poor condition. Counties that have no bridges or have no bridges in poor condition are excluded from the list.

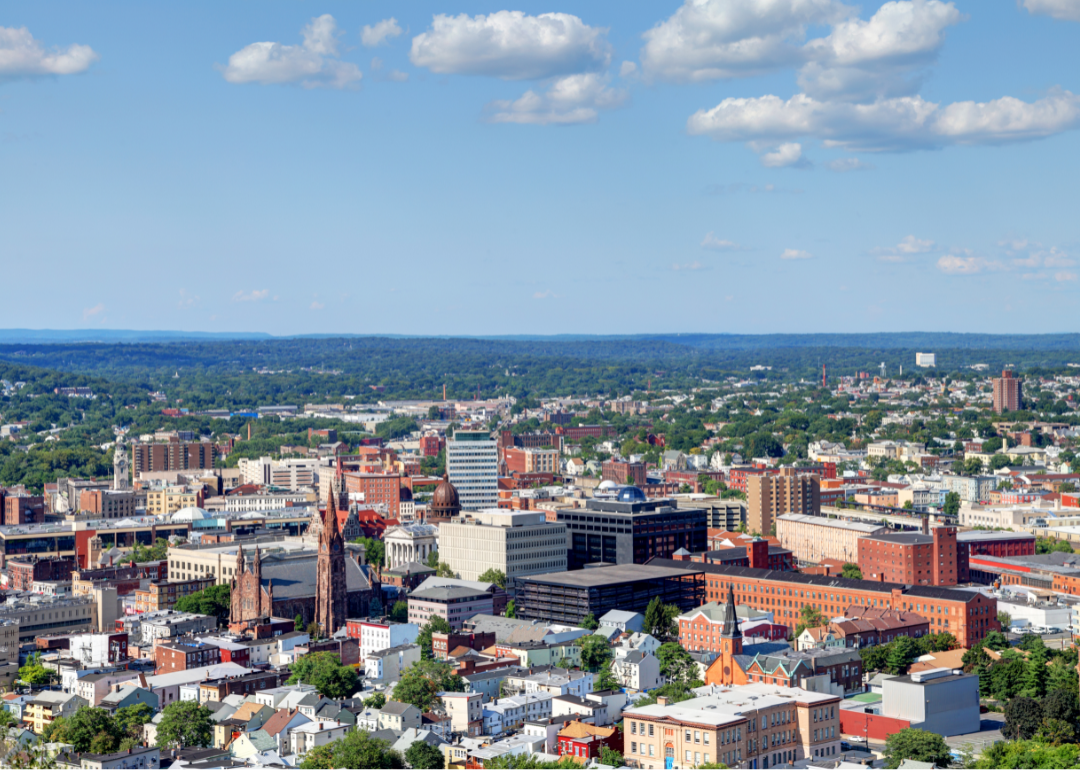
#20. Essex County
- Bridges in poor condition: 3.2% (16 of 499 bridges)
- Square meters of bridges in poor condition: 11.6% (111,444 of 964,731 square meters of bridges)
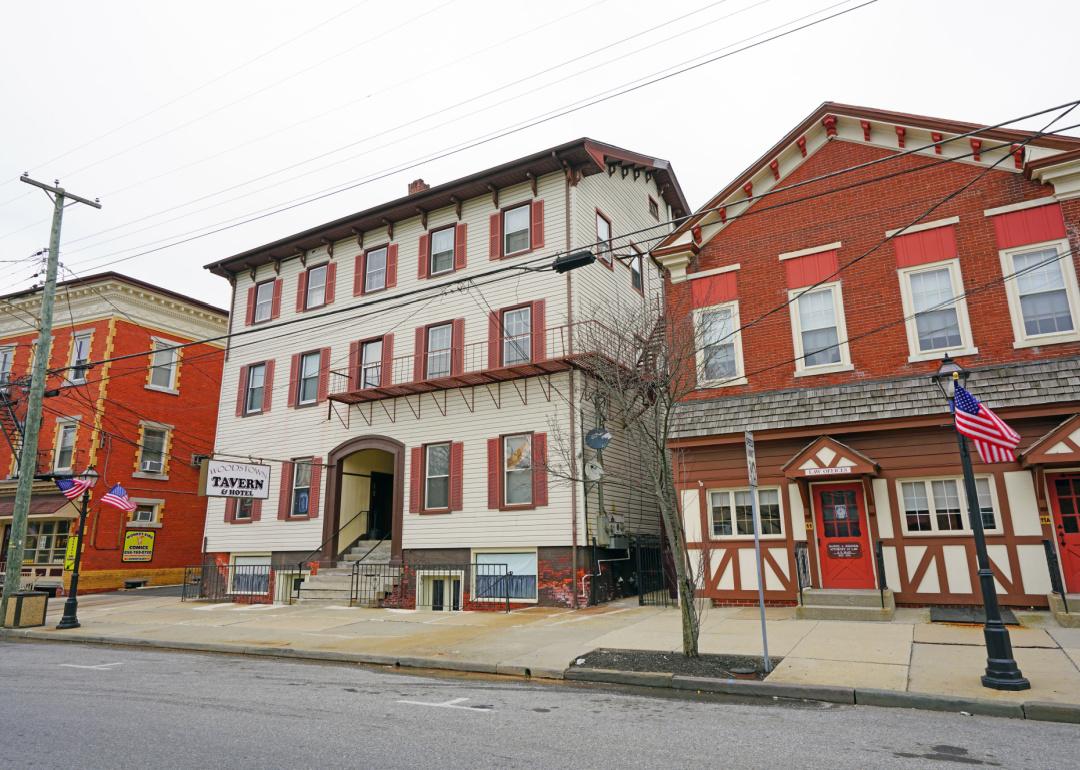
#19. Salem County
- Bridges in poor condition: 3.5% (4 of 114 bridges)
- Square meters of bridges in poor condition: 1.4% (2,217 of 162,646 square meters of bridges)

#18. Ocean County
- Bridges in poor condition: 3.7% (9 of 242 bridges)
- Square meters of bridges in poor condition: 10.9% (24,353 of 222,626 square meters of bridges)

#17. Middlesex County
- Bridges in poor condition: 4.3% (24 of 562 bridges)
- Square meters of bridges in poor condition: 1.6% (12,497 of 789,525 square meters of bridges)
#16. Warren County
- Bridges in poor condition: 4.5% (12 of 267 bridges)
- Square meters of bridges in poor condition: 3.4% (3,996 of 119,028 square meters of bridges)

#15. Union County
- Bridges in poor condition: 4.9% (20 of 408 bridges)
- Square meters of bridges in poor condition: 2.6% (14,015 of 544,740 square meters of bridges)
#14. Passaic County
- Bridges in poor condition: 5.1% (17 of 332 bridges)
- Square meters of bridges in poor condition: 7.0% (23,532 of 336,369 square meters of bridges)

#13. Bergen County
- Bridges in poor condition: 5.4% (31 of 576 bridges)
- Square meters of bridges in poor condition: 8.9% (68,426 of 767,261 square meters of bridges)

#12. Morris County
- Bridges in poor condition: 6.0% (30 of 504 bridges)
- Square meters of bridges in poor condition: 6.6% (17,021 of 258,878 square meters of bridges)

#11. Camden County
- Bridges in poor condition: 6.5% (17 of 260 bridges)
- Square meters of bridges in poor condition: 3.3% (15,450 of 472,018 square meters of bridges)
#10. Cumberland County
- Bridges in poor condition: 6.8% (7 of 103 bridges)
- Square meters of bridges in poor condition: 10.6% (4,434 of 41,657 square meters of bridges)

#9. Hudson County
- Bridges in poor condition: 7.0% (14 of 199 bridges)
- Square meters of bridges in poor condition: 12.8% (95,466 of 745,706 square meters of bridges)
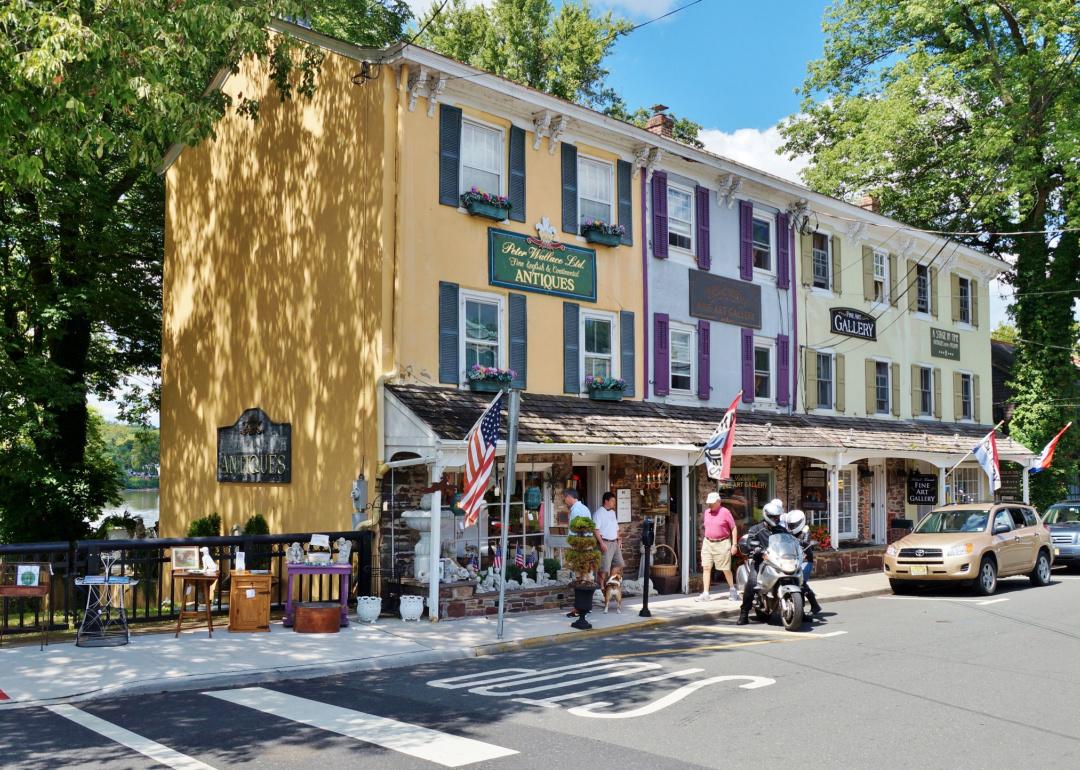
#8. Hunterdon County
- Bridges in poor condition: 7.2% (27 of 373 bridges)
- Square meters of bridges in poor condition: 4.4% (5,596 of 126,631 square meters of bridges)
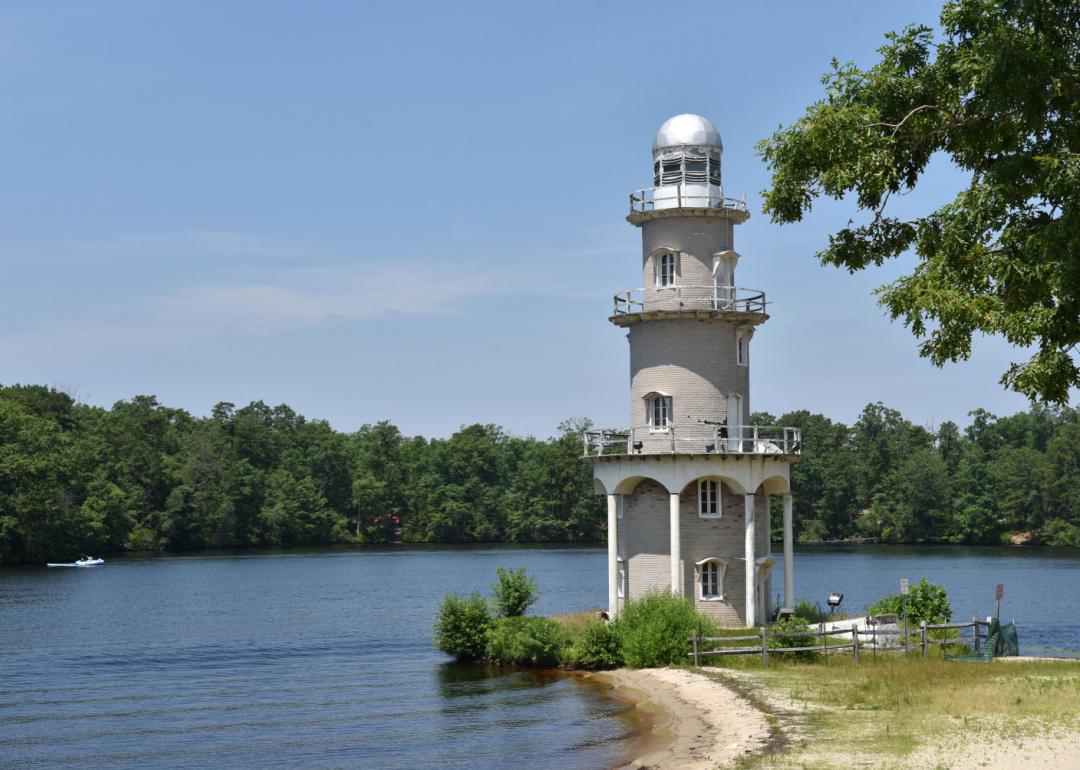
#7. Atlantic County
- Bridges in poor condition: 7.8% (16 of 205 bridges)
- Square meters of bridges in poor condition: 6.3% (14,292 of 225,810 square meters of bridges)

#6. Sussex County
- Bridges in poor condition: 9.1% (16 of 176 bridges)
- Square meters of bridges in poor condition: 8.3% (3,736 of 45,106 square meters of bridges)

#5. Mercer County
- Bridges in poor condition: 9.3% (38 of 410 bridges)
- Square meters of bridges in poor condition: 4.8% (18,531 of 384,417 square meters of bridges)
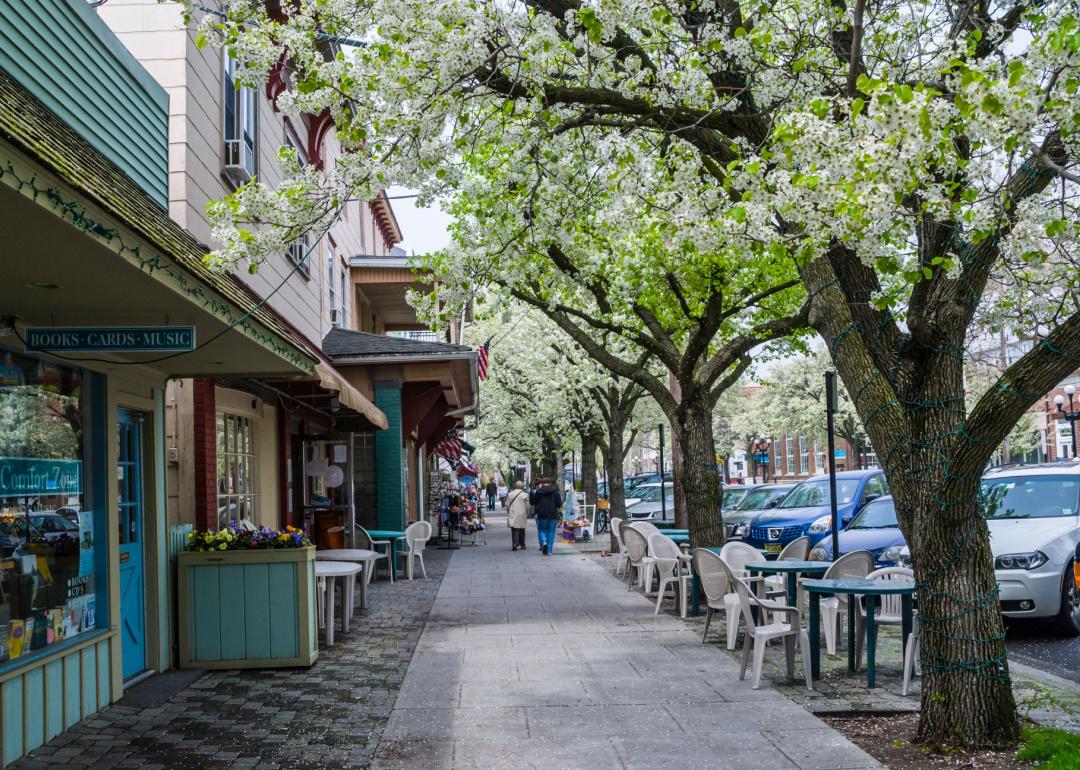
#4. Monmouth County
- Bridges in poor condition: 10.1% (51 of 505 bridges)
- Square meters of bridges in poor condition: 7.1% (24,957 of 353,219 square meters of bridges)
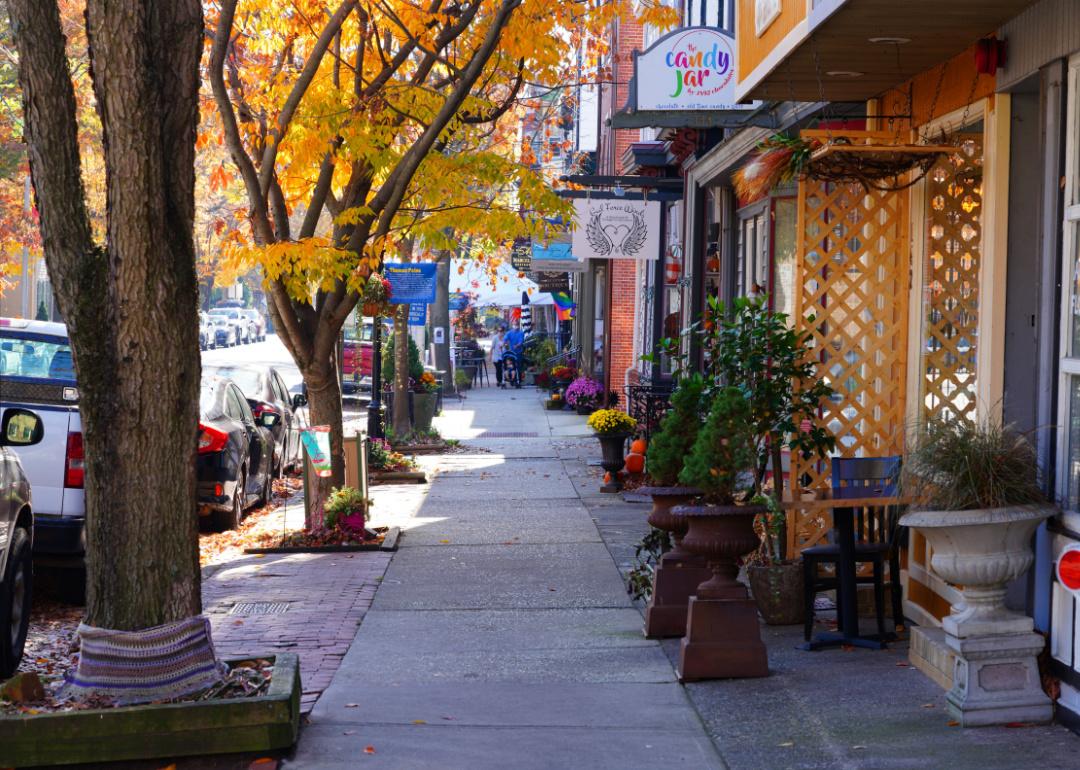
#3. Burlington County
- Bridges in poor condition: 11.2% (40 of 356 bridges)
- Square meters of bridges in poor condition: 2.6% (9,075 of 342,971 square meters of bridges)

#2. Somerset County
- Bridges in poor condition: 11.6% (46 of 396 bridges)
- Square meters of bridges in poor condition: 12.0% (24,002 of 200,692 square meters of bridges)

#1. Cape May County
- Bridges in poor condition: 17.6% (13 of 74 bridges)
- Square meters of bridges in poor condition: 12.6% (20,631 of 164,107 square meters of bridges)