Cities with the most expensive homes in New Jersey
Purchasing a home is among the most important investments a person will make in their lifetime. More than a place to live, homeownership is an asset with the potential to tremendously rise in value. But with home prices reaching record heights, affordability plays a huge role—and, increasingly, is a huge barrier—for buyers.
In March, the typical home value in the United States was $355,696—4.6% higher than the previous year.
High mortgage rates have also had a major impact on affordability: As of April 25, the 30-year fixed mortgage rate stands at 7.17%, three points higher than the average mortgage American households are sitting on. That disparity has kept many people in homes they might otherwise leave—to pursue another job, to downsize, or to upsize—further squeezing an already-tight market.
While home prices are up across the U.S., certain cities command significantly higher prices than others. Location, size, age, and condition are all contributing factors to home values.
Stacker compiled a list of cities with the most expensive homes in New Jersey using data from Zillow. Cities are ranked by the Zillow Home Values Index for all homes as of March 2024. The charts in this story were created automatically using Matplotlib.
Metros with the most cities in the top 30 in New Jersey
#1. New York-Newark-Jersey City, NY-NJ-PA: 24
#2. Ocean City, NJ: 5
#3. Atlantic City-Hammonton, NJ: 1
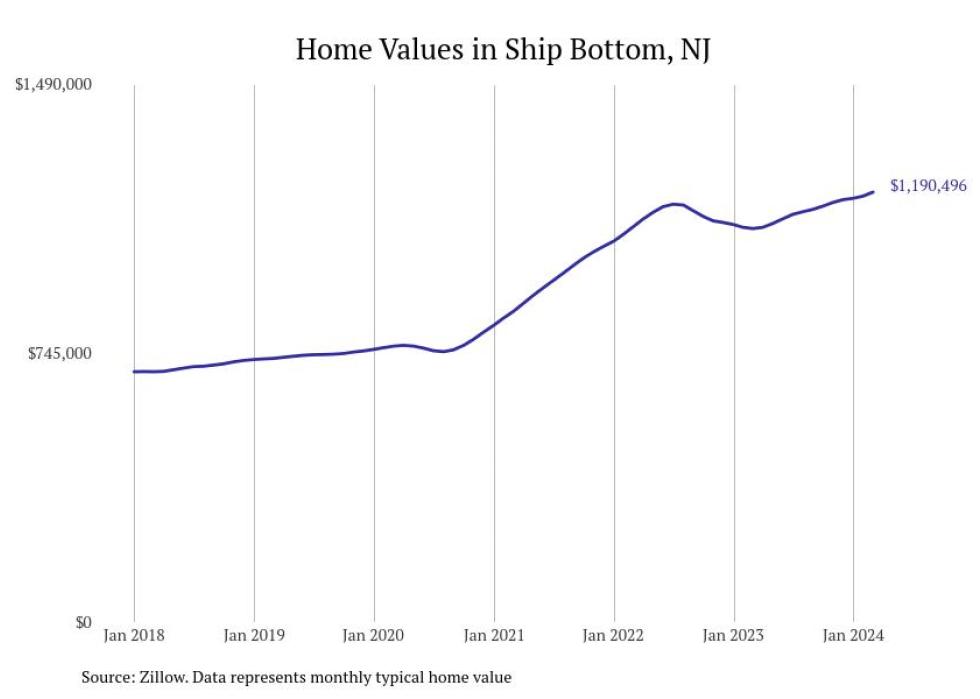
#30. Ship Bottom
- Typical home value: $1,190,496
- 1-year price change: +9.3%
- 5-year price change: +63.1%
- Metro area: New York-Newark-Jersey City, NY-NJ-PA
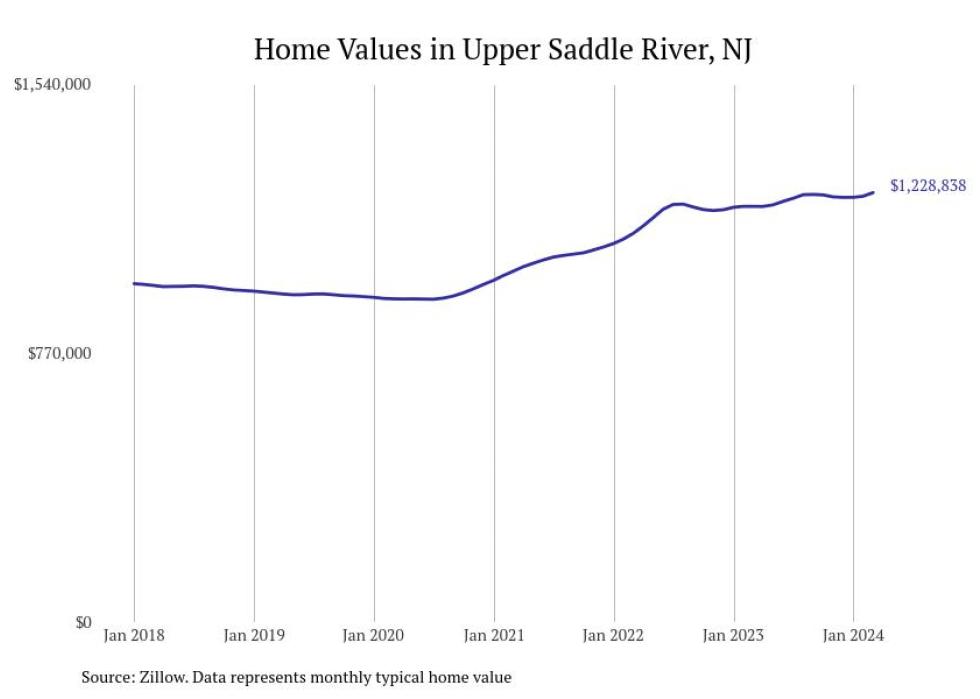
#29. Upper Saddle River
- Typical home value: $1,228,838
- 1-year price change: +3.3%
- 5-year price change: +30.5%
- Metro area: New York-Newark-Jersey City, NY-NJ-PA
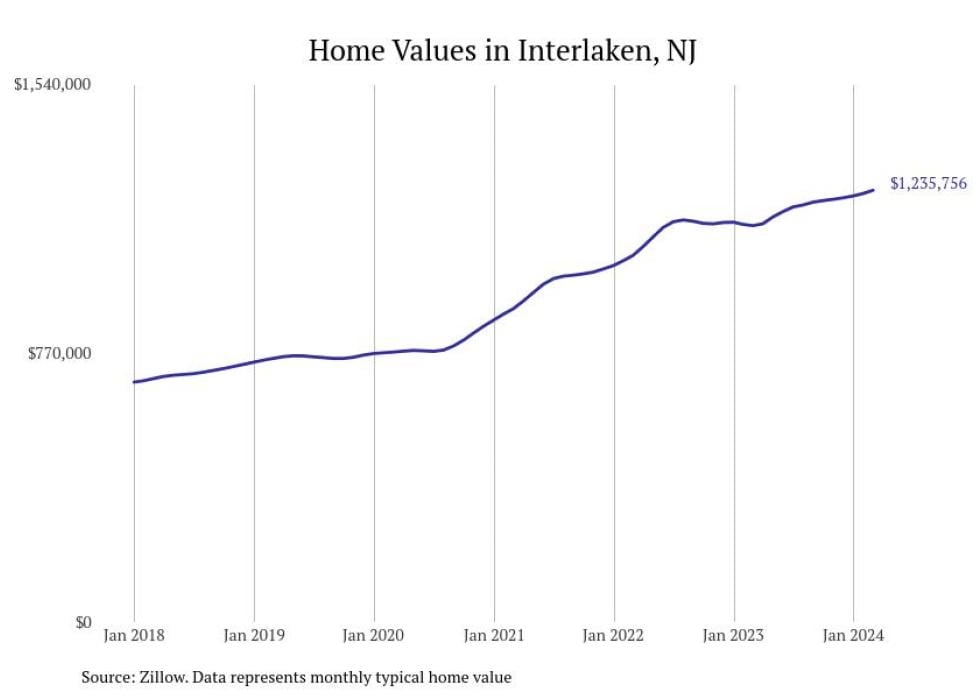
#28. Interlaken
- Typical home value: $1,235,756
- 1-year price change: +8.9%
- 5-year price change: +63.8%
- Metro area: New York-Newark-Jersey City, NY-NJ-PA
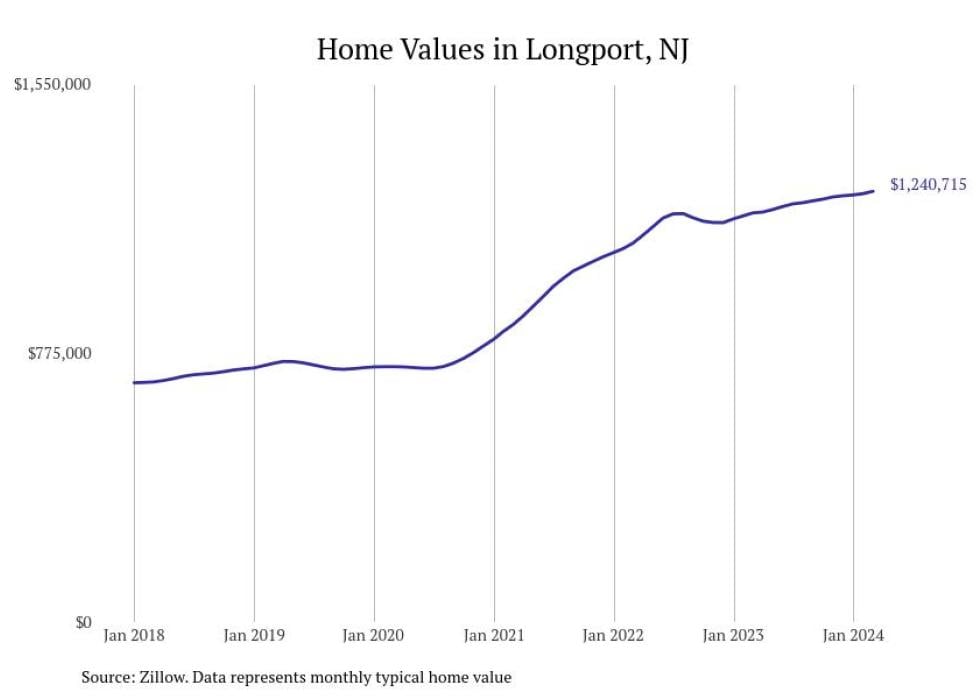
#27. Longport
- Typical home value: $1,240,715
- 1-year price change: +5.3%
- 5-year price change: +66.5%
- Metro area: Atlantic City-Hammonton, NJ

#26. Fair Haven
- Typical home value: $1,300,639
- 1-year price change: +12.1%
- 5-year price change: +57.7%
- Metro area: New York-Newark-Jersey City, NY-NJ-PA

#25. Sea Isle City
- Typical home value: $1,306,908
- 1-year price change: +0.0%
- 5-year price change: +68.3%
- Metro area: Ocean City, NJ
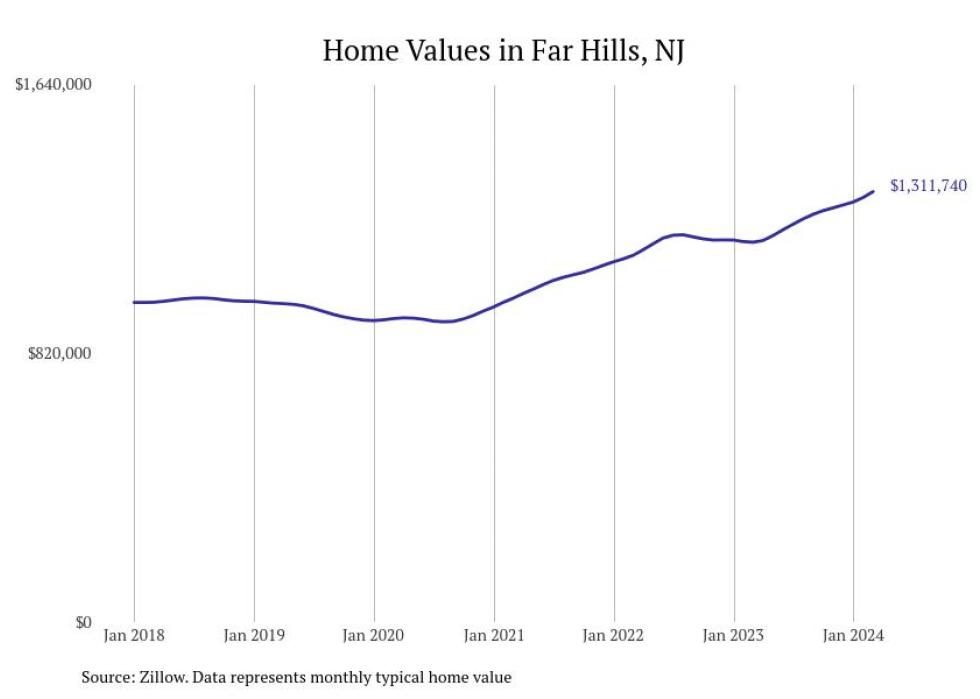
#24. Far Hills
- Typical home value: $1,311,740
- 1-year price change: +13.3%
- 5-year price change: +35.0%
- Metro area: New York-Newark-Jersey City, NY-NJ-PA
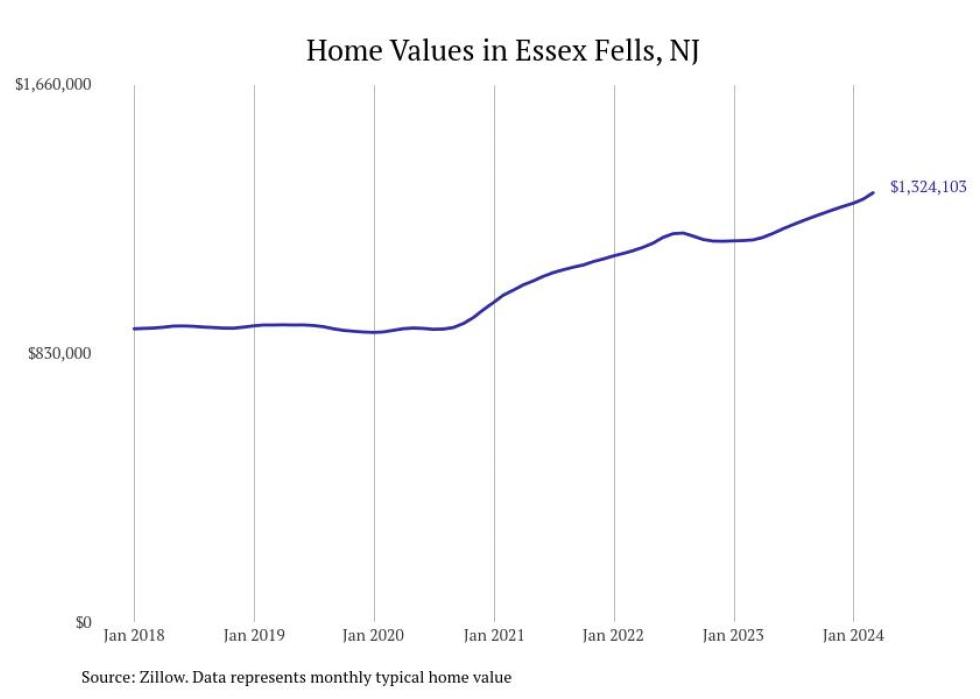
#23. Essex Fells
- Typical home value: $1,324,103
- 1-year price change: +12.3%
- 5-year price change: +44.5%
- Metro area: New York-Newark-Jersey City, NY-NJ-PA
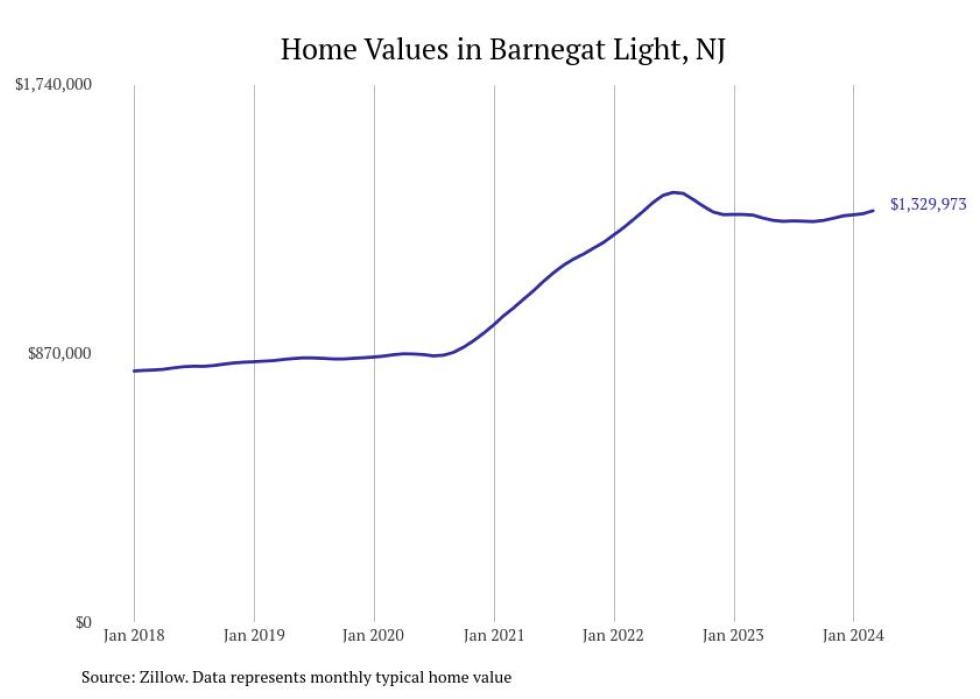
#22. Barnegat Light
- Typical home value: $1,329,973
- 1-year price change: +1.1%
- 5-year price change: +57.3%
- Metro area: New York-Newark-Jersey City, NY-NJ-PA
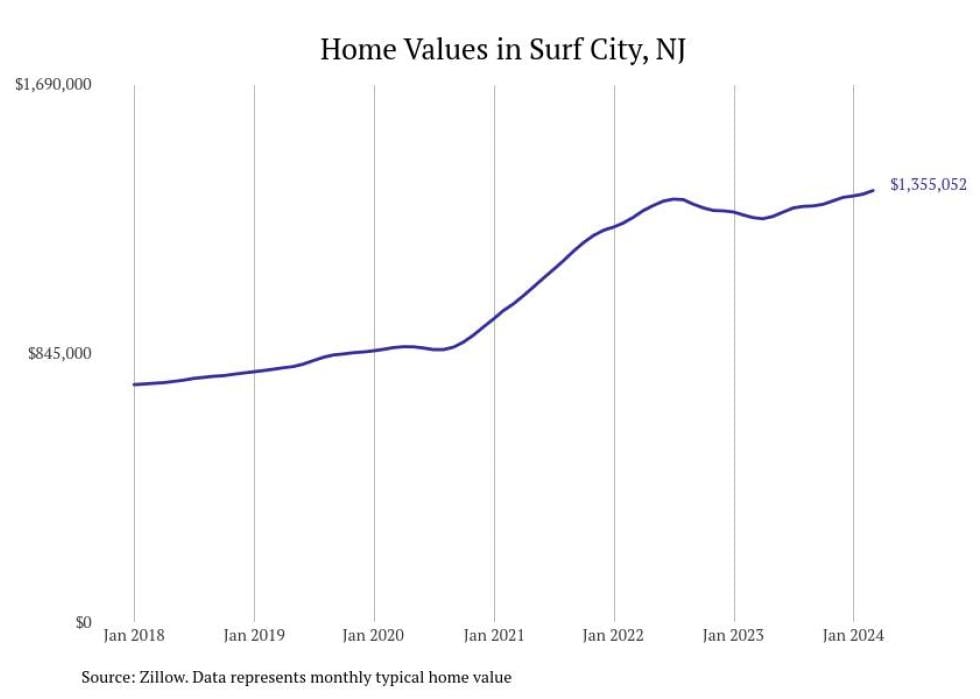
#21. Surf City
- Typical home value: $1,355,052
- 1-year price change: +6.7%
- 5-year price change: +70.7%
- Metro area: New York-Newark-Jersey City, NY-NJ-PA
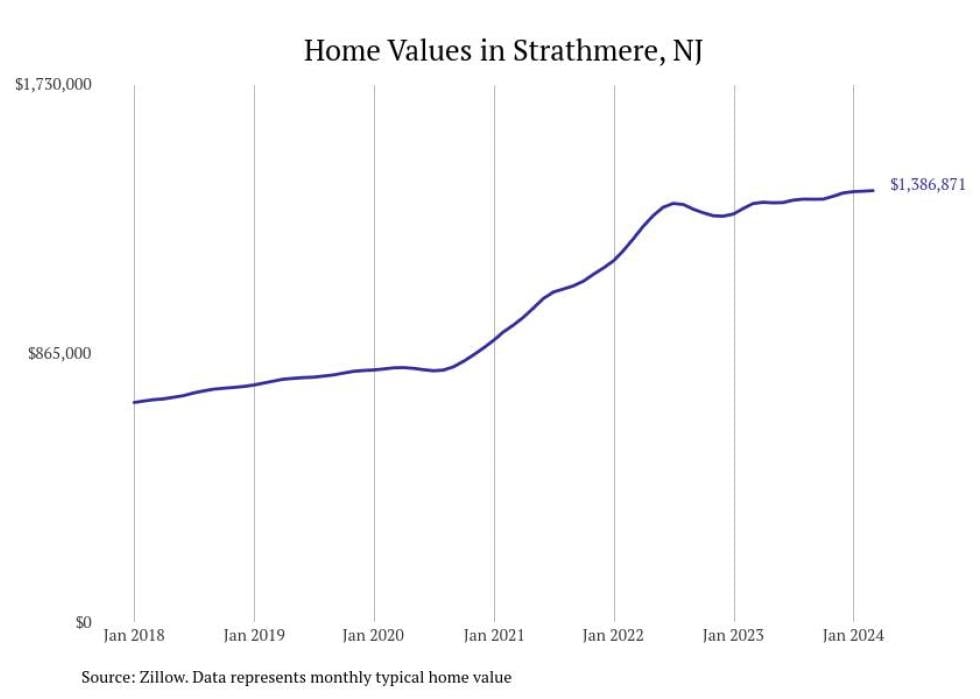
#20. Strathmere
- Typical home value: $1,386,871
- 1-year price change: +3.1%
- 5-year price change: +79.1%
- Metro area: Ocean City, NJ
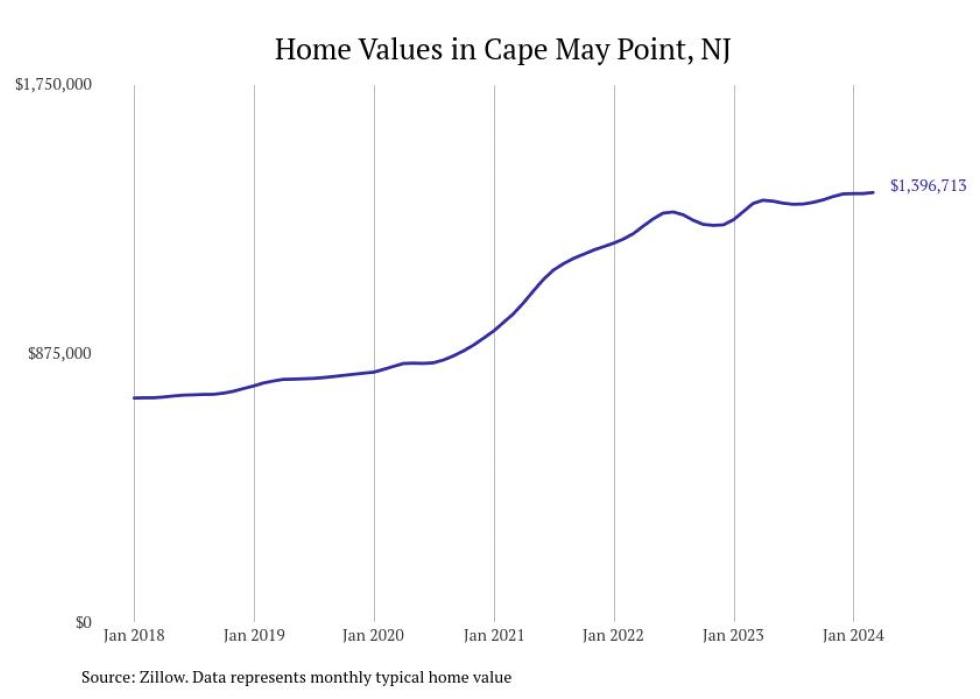
#19. Cape May Point
- Typical home value: $1,396,713
- 1-year price change: +2.6%
- 5-year price change: +78.2%
- Metro area: Ocean City, NJ
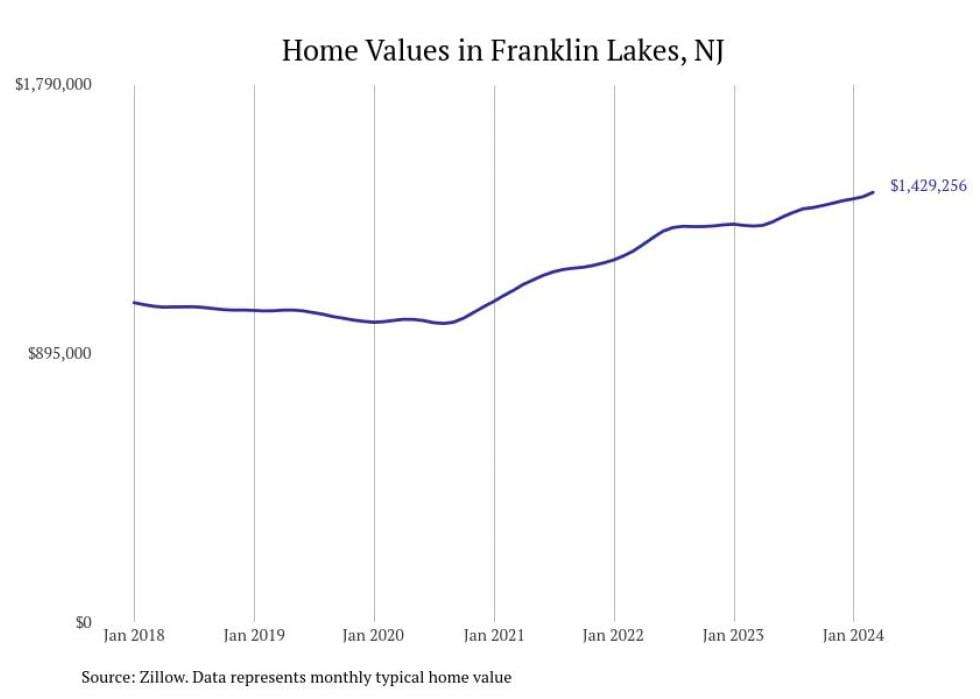
#18. Franklin Lakes
- Typical home value: $1,429,256
- 1-year price change: +8.5%
- 5-year price change: +38.0%
- Metro area: New York-Newark-Jersey City, NY-NJ-PA
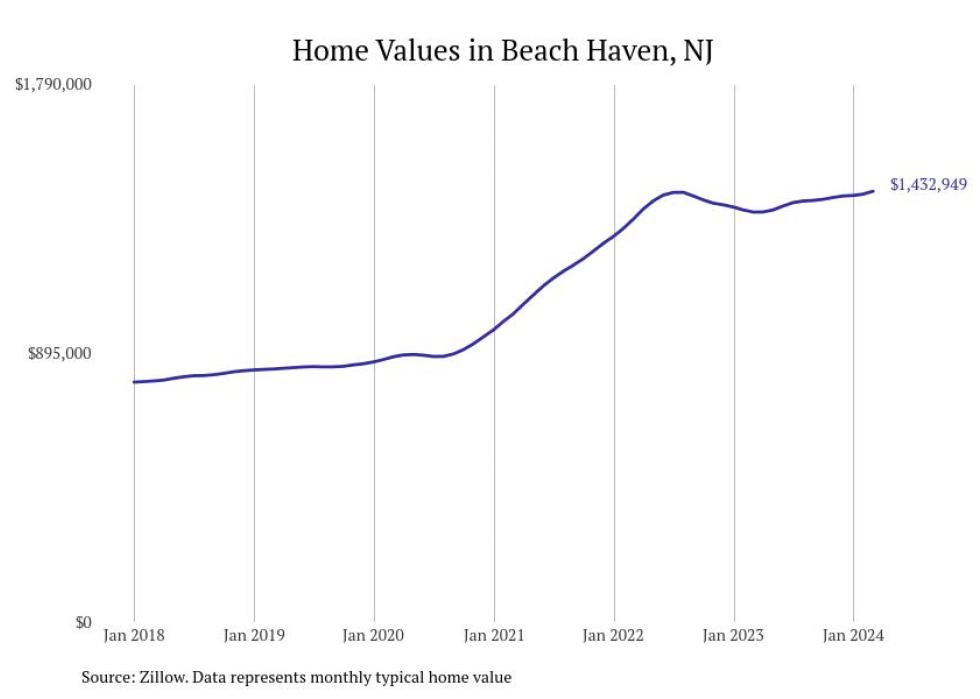
#17. Beach Haven
- Typical home value: $1,432,949
- 1-year price change: +5.1%
- 5-year price change: +70.3%
- Metro area: New York-Newark-Jersey City, NY-NJ-PA

#16. Englewood Cliffs
- Typical home value: $1,473,942
- 1-year price change: +3.7%
- 5-year price change: +20.3%
- Metro area: New York-Newark-Jersey City, NY-NJ-PA
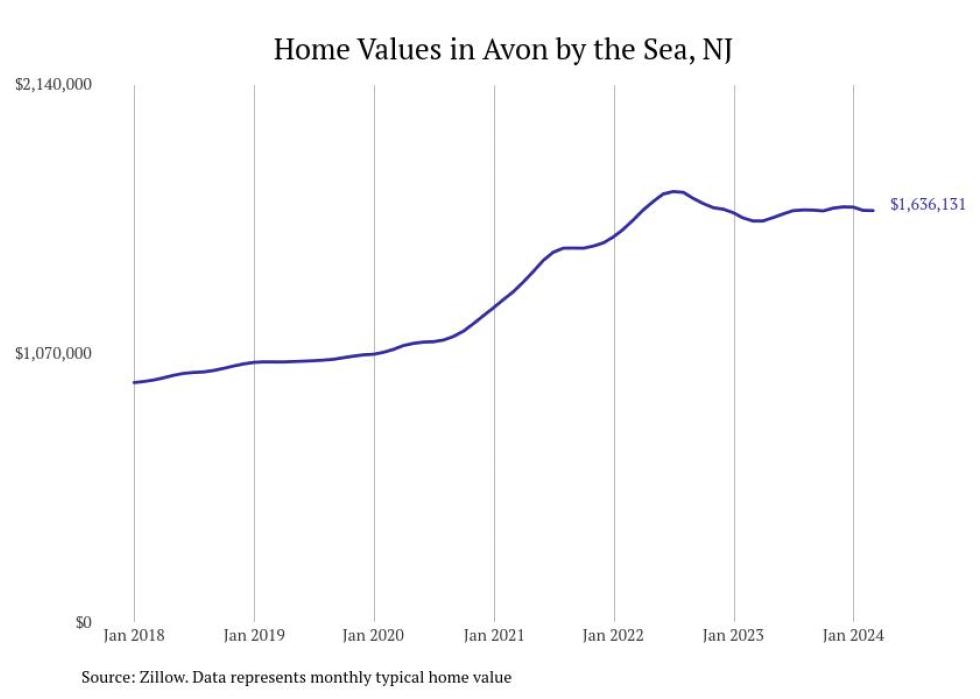
#15. Avon by the Sea
- Typical home value: $1,636,131
- 1-year price change: +2.6%
- 5-year price change: +58.2%
- Metro area: New York-Newark-Jersey City, NY-NJ-PA
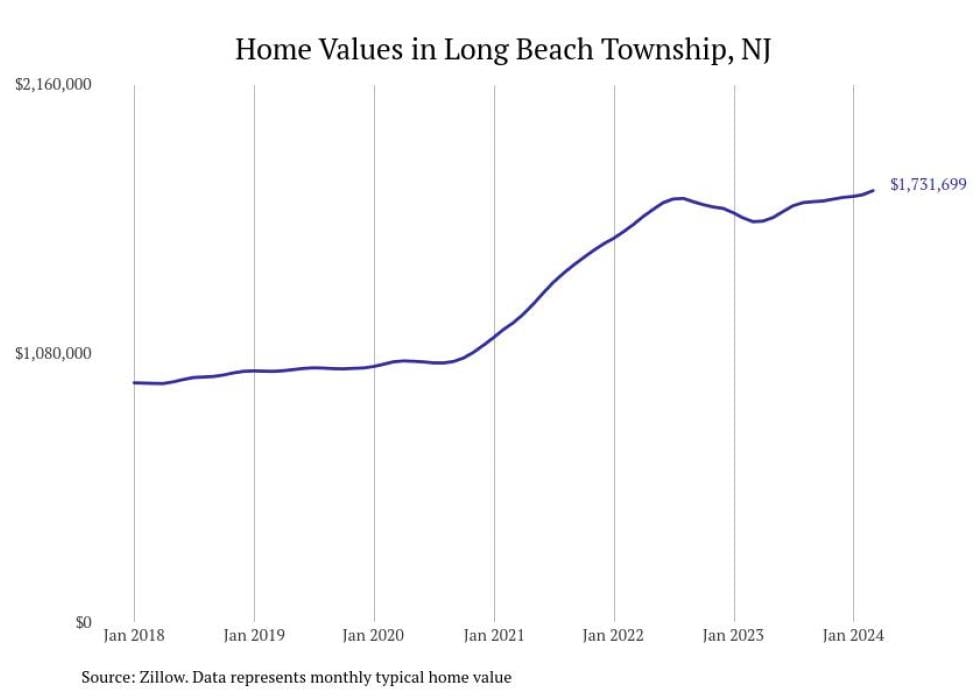
#14. Long Beach Township
- Typical home value: $1,731,699
- 1-year price change: +7.8%
- 5-year price change: +72.1%
- Metro area: New York-Newark-Jersey City, NY-NJ-PA
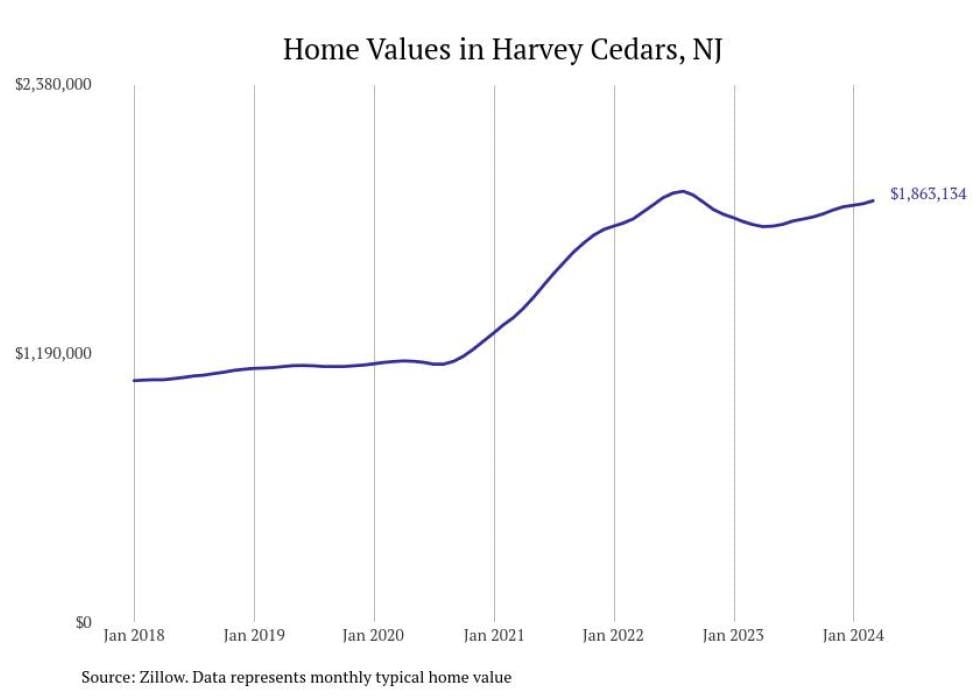
#13. Harvey Cedars
- Typical home value: $1,863,134
- 1-year price change: +6.0%
- 5-year price change: +65.5%
- Metro area: New York-Newark-Jersey City, NY-NJ-PA
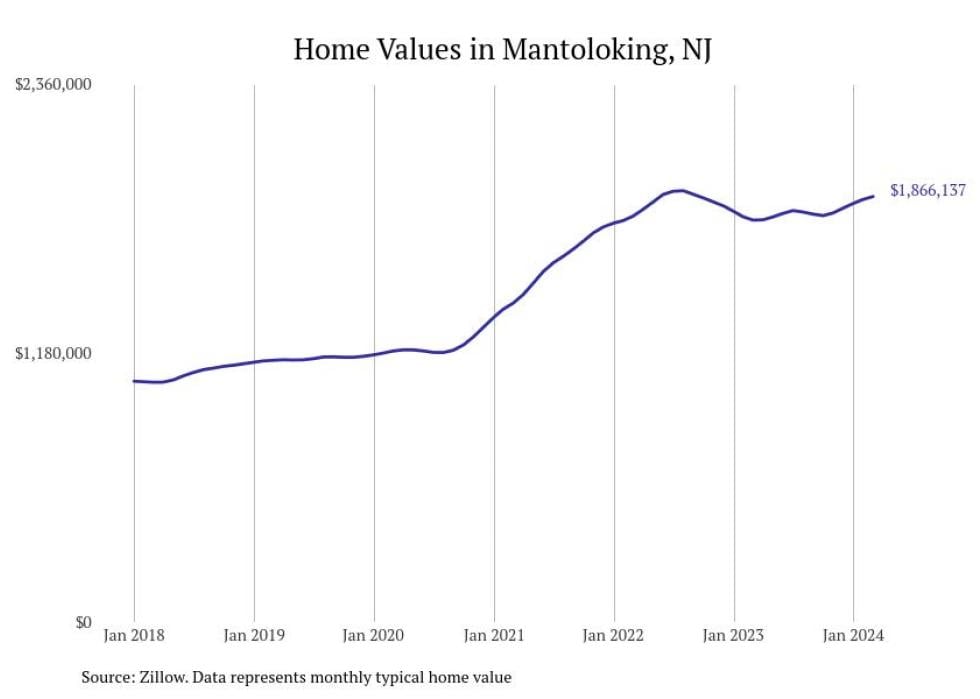
#12. Mantoloking
- Typical home value: $1,866,137
- 1-year price change: +5.9%
- 5-year price change: +62.6%
- Metro area: New York-Newark-Jersey City, NY-NJ-PA
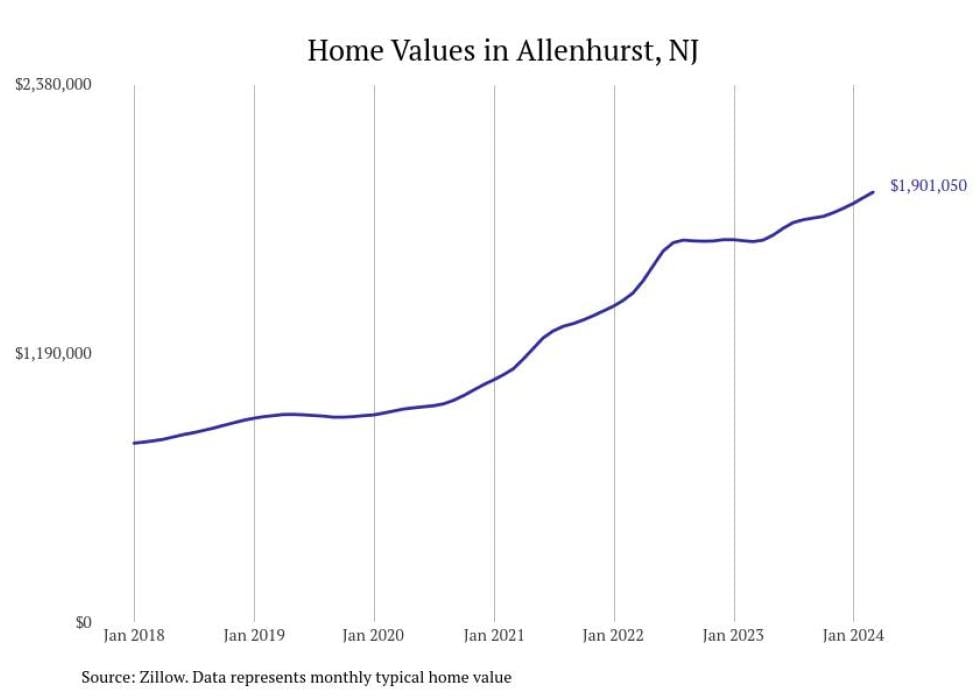
#11. Allenhurst
- Typical home value: $1,901,050
- 1-year price change: +13.0%
- 5-year price change: +108.2%
- Metro area: New York-Newark-Jersey City, NY-NJ-PA
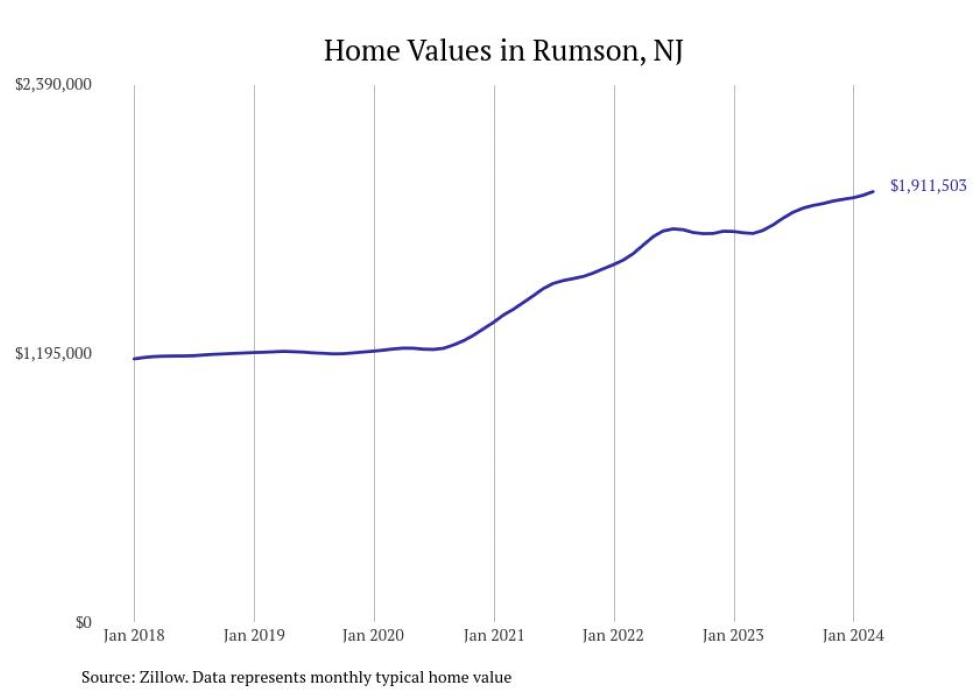
#10. Rumson
- Typical home value: $1,911,503
- 1-year price change: +10.8%
- 5-year price change: +59.3%
- Metro area: New York-Newark-Jersey City, NY-NJ-PA
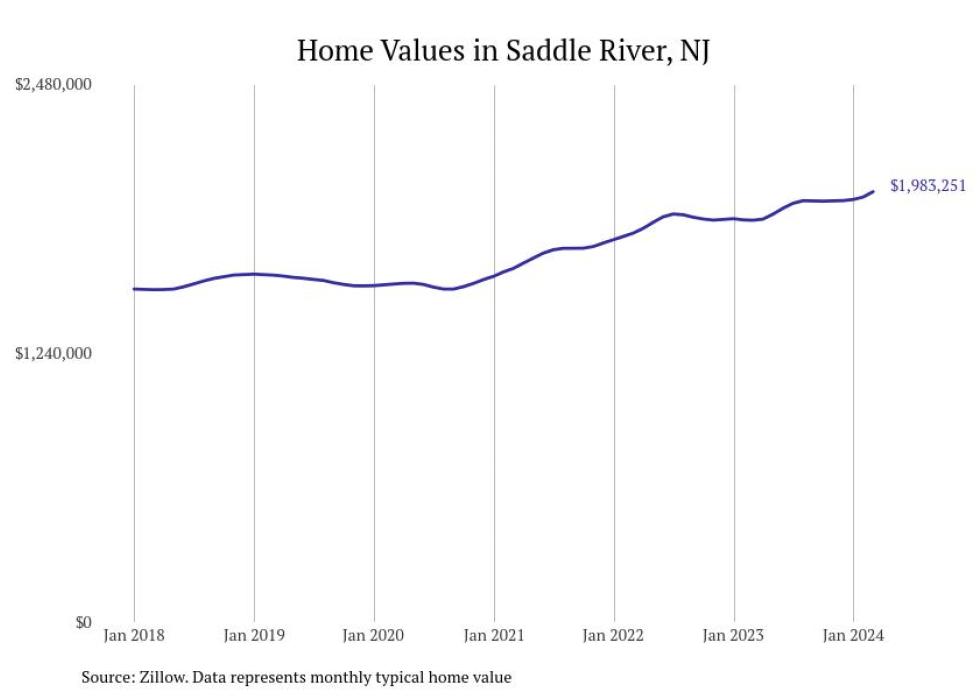
#9. Saddle River
- Typical home value: $1,983,251
- 1-year price change: +7.1%
- 5-year price change: +24.0%
- Metro area: New York-Newark-Jersey City, NY-NJ-PA
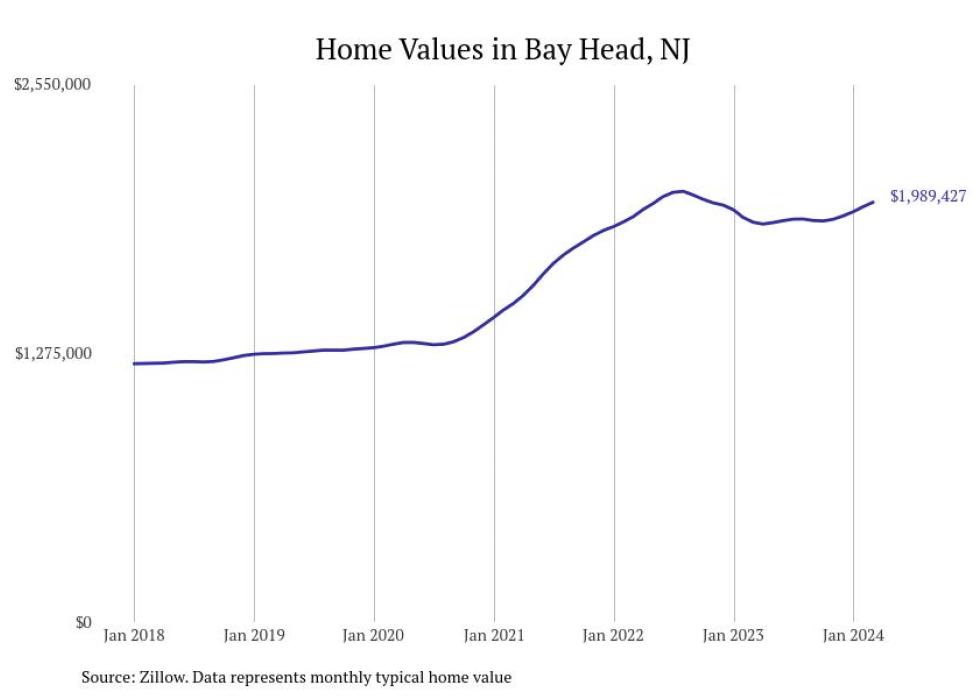
#8. Bay Head
- Typical home value: $1,989,427
- 1-year price change: +5.0%
- 5-year price change: +56.4%
- Metro area: New York-Newark-Jersey City, NY-NJ-PA
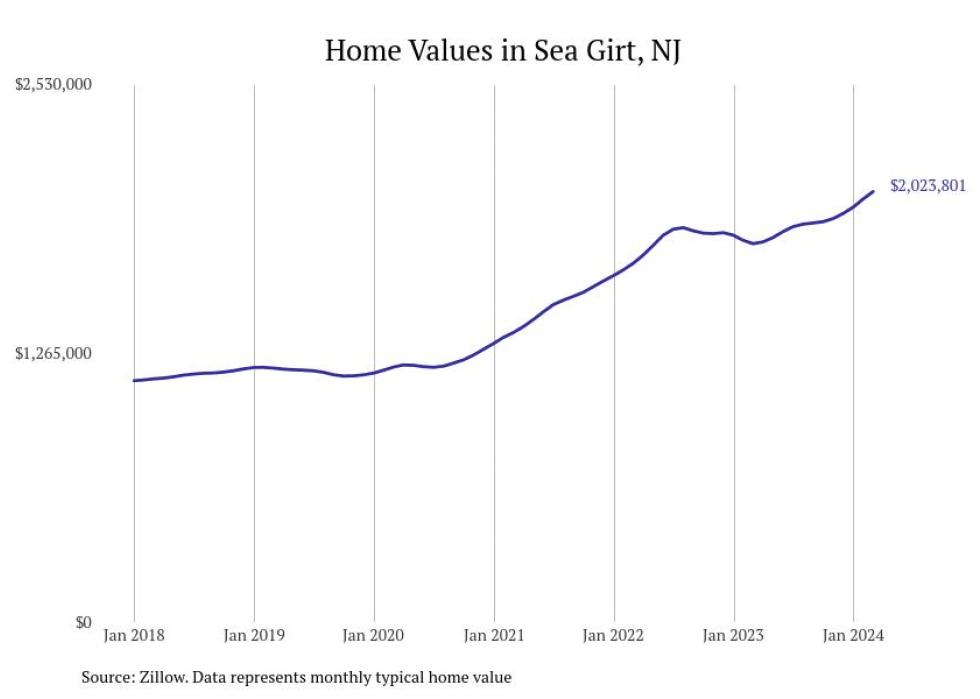
#7. Sea Girt
- Typical home value: $2,023,801
- 1-year price change: +13.8%
- 5-year price change: +69.5%
- Metro area: New York-Newark-Jersey City, NY-NJ-PA
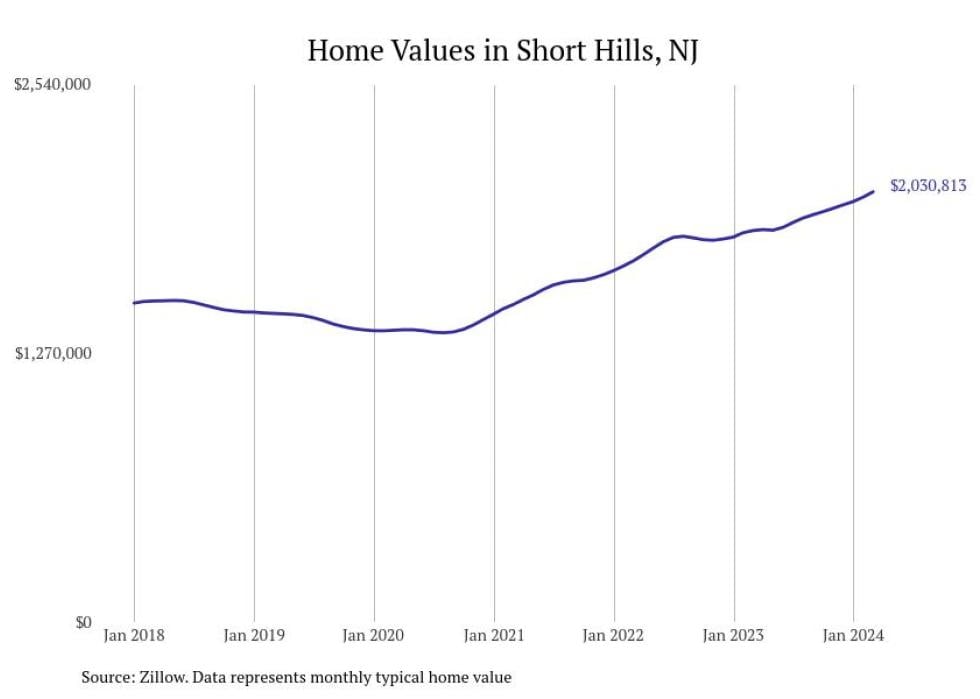
#6. Short Hills
- Typical home value: $2,030,813
- 1-year price change: +9.9%
- 5-year price change: +39.4%
- Metro area: New York-Newark-Jersey City, NY-NJ-PA
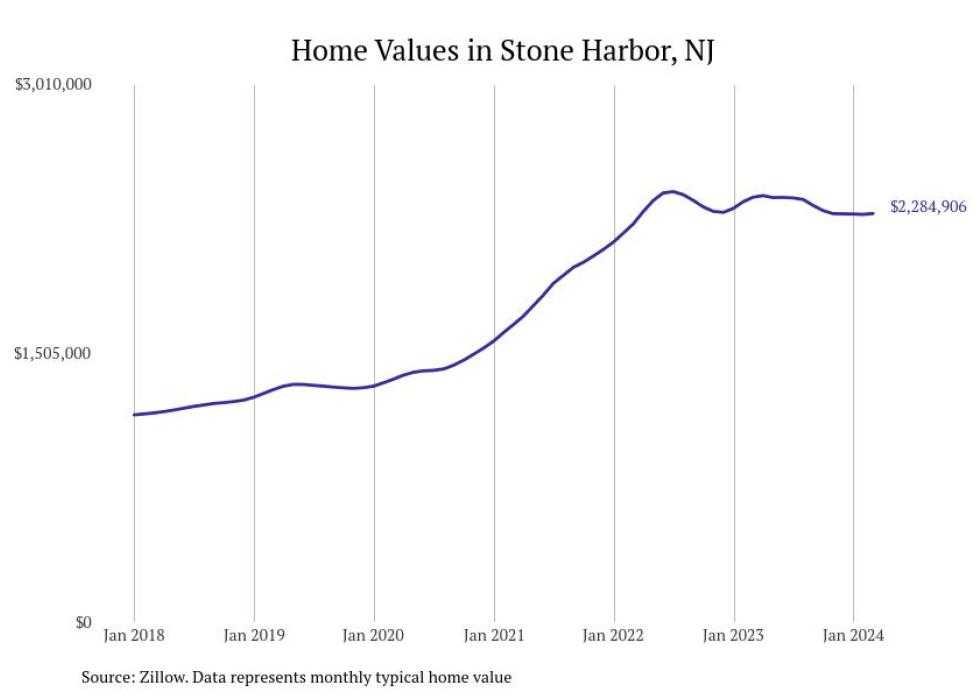
#5. Stone Harbor
- Typical home value: $2,284,906
- 1-year price change: -3.8%
- 5-year price change: +75.8%
- Metro area: Ocean City, NJ
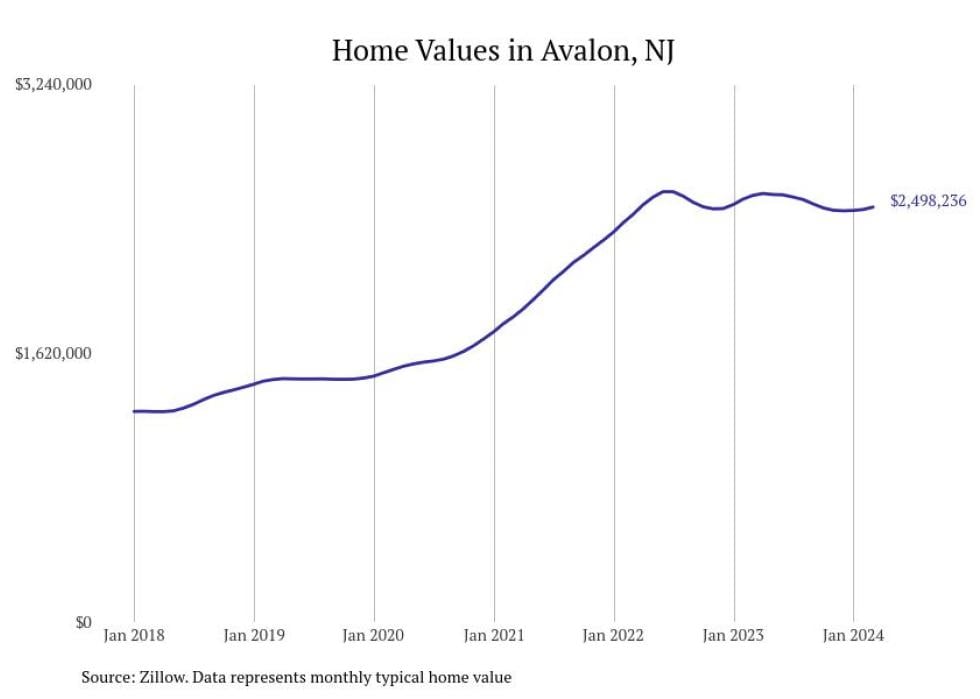
#4. Avalon
- Typical home value: $2,498,236
- 1-year price change: -2.7%
- 5-year price change: +71.1%
- Metro area: Ocean City, NJ
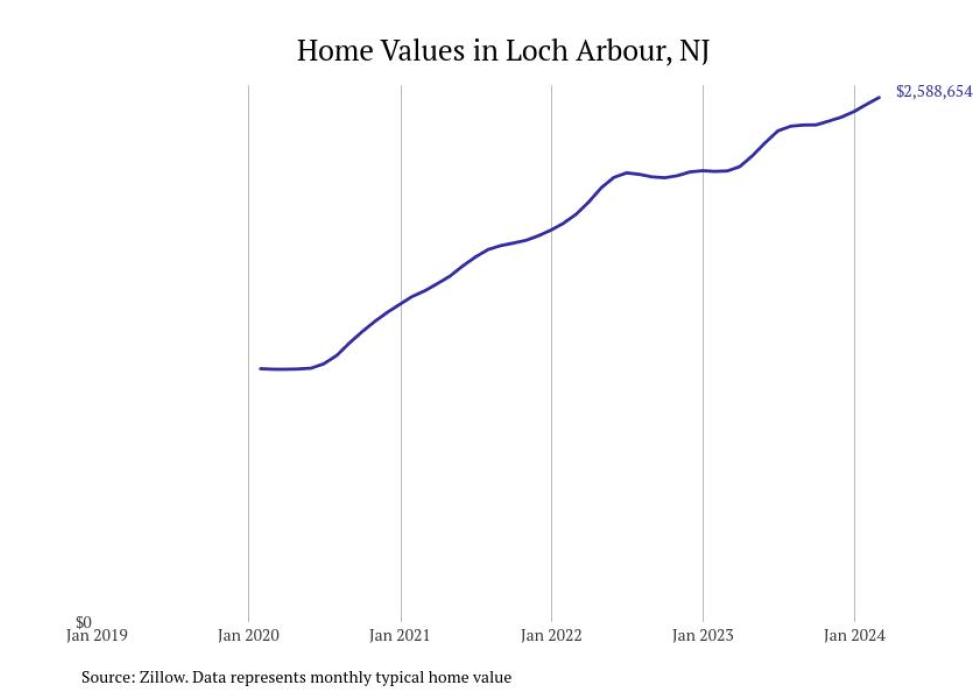
#3. Loch Arbour
- Typical home value: $2,588,654
- 1-year price change: +16.3%
- 5-year price change: data not available
- Metro area: New York-Newark-Jersey City, NY-NJ-PA
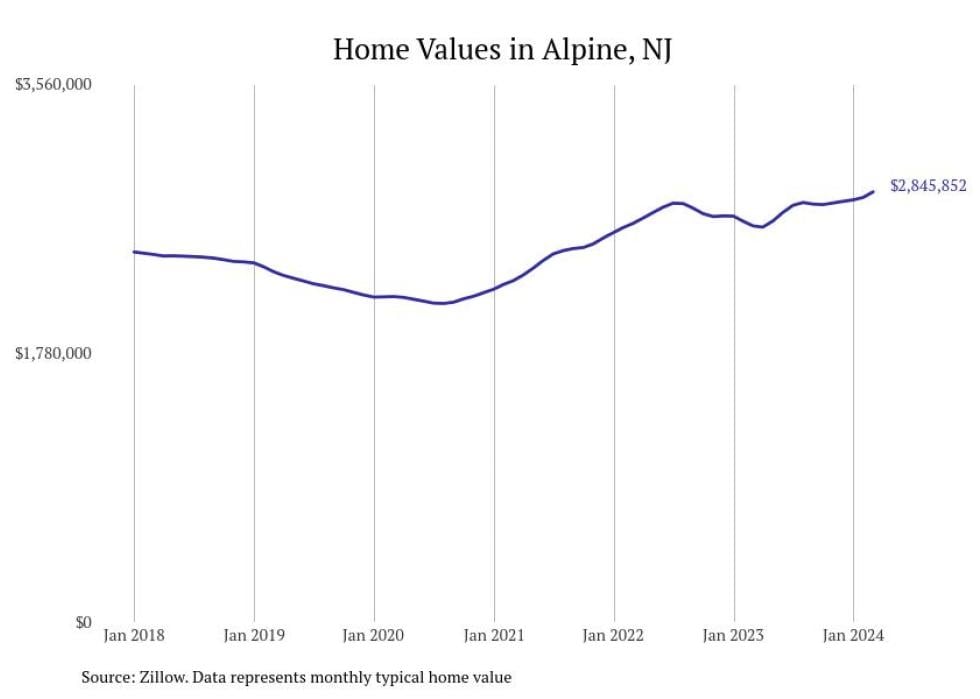
#2. Alpine
- Typical home value: $2,845,852
- 1-year price change: +8.6%
- 5-year price change: +22.7%
- Metro area: New York-Newark-Jersey City, NY-NJ-PA
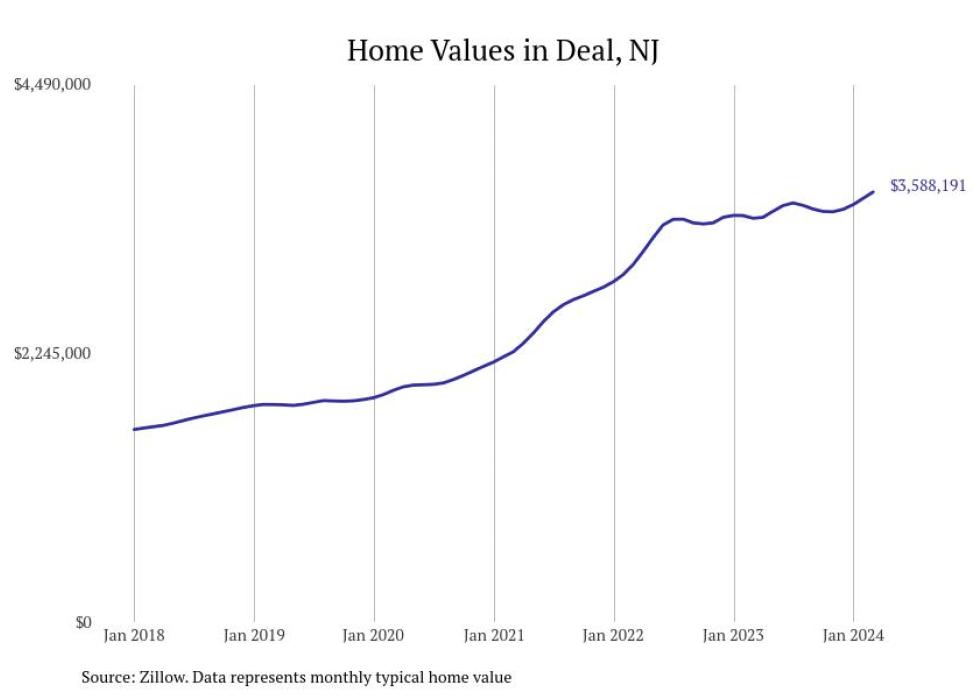
#1. Deal
- Typical home value: $3,588,191
- 1-year price change: +6.5%
- 5-year price change: +97.7%
- Metro area: New York-Newark-Jersey City, NY-NJ-PA
This story features data reporting and writing by Elena Cox and is part of a series utilizing data automation across 50 states.


