
Wettest counties in Mississippi
Rain, sleet, snow, hail, wintry mix. Precipitation takes on many forms, and the degree to which climate change affects precipitation levels comes down to something almost everyone learns about in school—Earth's water cycle. A system in endless motion, the water cycle traces the process through which water exists in its three primary phases—liquid, solid, and gas—as it moves perpetually between the Earth and its atmosphere.
Increases in precipitation frequency and intensity are markers of climate change. When temperatures rise and oceans grow warmer, the amount of water that evaporates into the atmosphere—and the speed at which it does so—also increases. As atmospheric circulation carries the moisture-rich air over land or pushes it into a storm system, heavy rain or snow is often the result.
The continental U.S. on average received about 30 inches of precipitation between March 2022 and February 2023. Traditionally "wet" regions—such as Washington state and Alaska in the northwest and Georgia and Mississippi in the southeast—continue to have some of the rainiest counties in the United States. Other areas such as Oklahoma, Kansas, and Nebraska, as well as pockets of the South and of California, experience the opposite extreme: drought, also largely a product of climate change.
Stacker cited data from the National Centers for Environmental Information to identify the counties in Mississippi that receive the most precipitation through rain, sleet, or snow. Counties are ranked by five-year precipitation averages in inches as of February 2023 with rainfall over the past year serving as a tiebreaker. Supplementary data on how last year's precipitation compares to the 100-year average for the area is also included.

#50. Marshall County
- Precipitation over the past year: 56.61 inches (#74 rainiest year since 1895)
- Precipitation compared to 1901-2000 average: 2.83 inches above norm

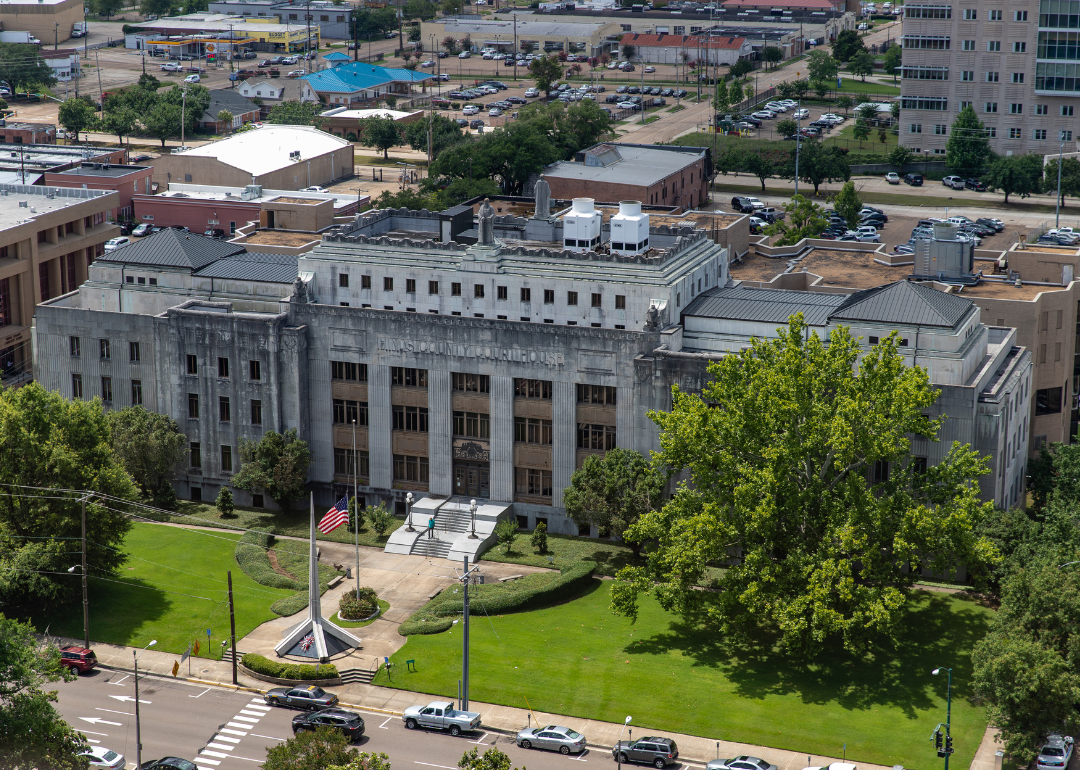
#49. Lowndes County
- Precipitation over the past year: 56.23 inches (#80 rainiest year since 1895)
- Precipitation compared to 1901-2000 average: 3.23 inches above norm

#48. Union County
- Precipitation over the past year: 52.24 inches (#59 rainiest year since 1895)
- Precipitation compared to 1901-2000 average: -1.63 inches below norm

#47. Prentiss County
- Precipitation over the past year: 50.88 inches (#49 rainiest year since 1895)
- Precipitation compared to 1901-2000 average: -3.06 inches below norm

#46. Tippah County
- Precipitation over the past year: 53.01 inches (#57 rainiest year since 1895)
- Precipitation compared to 1901-2000 average: -1.23 inches below norm

#45. Noxubee County
- Precipitation over the past year: 59.68 inches (#101 rainiest year since 1895)
- Precipitation compared to 1901-2000 average: 7.58 inches above norm

#44. Choctaw County
- Precipitation over the past year: 61.07 inches (#99 rainiest year since 1895)
- Precipitation compared to 1901-2000 average: 7.11 inches above norm

#43. Copiah County
- Precipitation over the past year: 70.96 inches (#122 rainiest year since 1895)
- Precipitation compared to 1901-2000 average: 15.28 inches above norm

#42. Neshoba County
- Precipitation over the past year: 65.77 inches (#110 rainiest year since 1895)
- Precipitation compared to 1901-2000 average: 10.68 inches above norm

#41. Clay County
- Precipitation over the past year: 59.05 inches (#94 rainiest year since 1895)
- Precipitation compared to 1901-2000 average: 5.91 inches above norm

#40. Benton County
- Precipitation over the past year: 56.46 inches (#68 rainiest year since 1895)
- Precipitation compared to 1901-2000 average: 1.98 inches above norm

#39. Wilkinson County
- Precipitation over the past year: 71.72 inches (#117 rainiest year since 1895)
- Precipitation compared to 1901-2000 average: 12.37 inches above norm

#38. Madison County
- Precipitation over the past year: 69.94 inches (#123 rainiest year since 1895)
- Precipitation compared to 1901-2000 average: 17.48 inches above norm

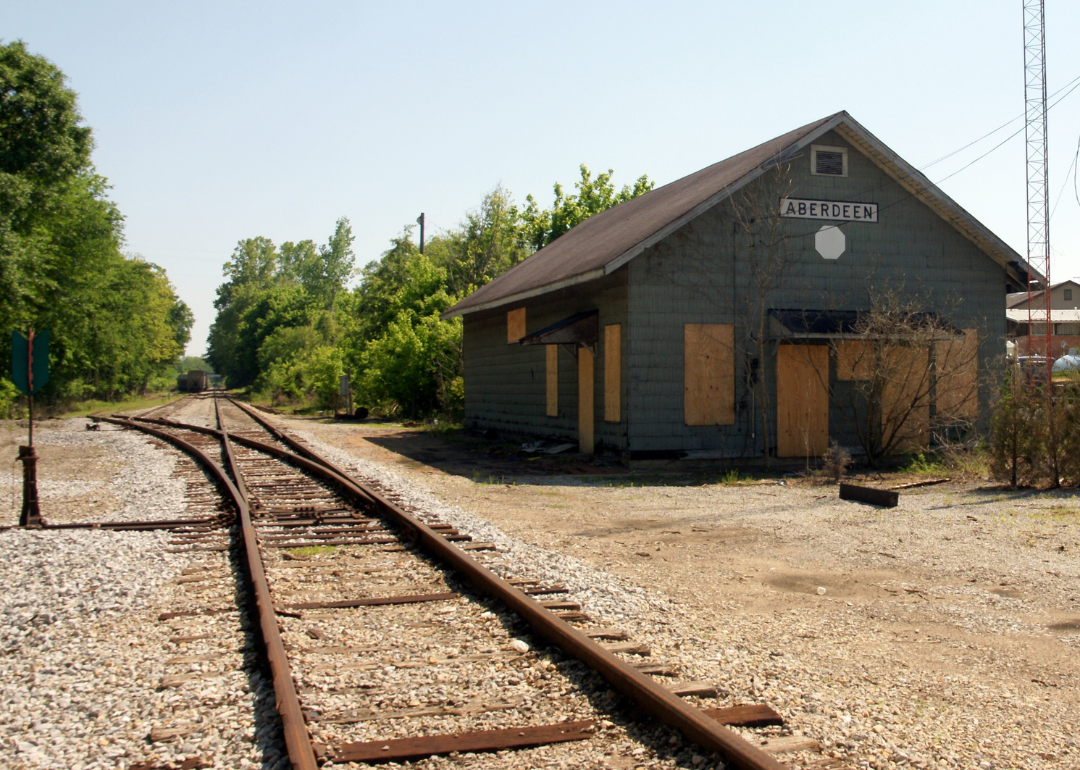
#37. Alcorn County
- Precipitation over the past year: 51.14 inches (#49 rainiest year since 1895)
- Precipitation compared to 1901-2000 average: -2.37 inches below norm

#36. Winston County
- Precipitation over the past year: 63.72 inches (#110 rainiest year since 1895)
- Precipitation compared to 1901-2000 average: 9.91 inches above norm
#35. Monroe County
- Precipitation over the past year: 58.38 inches (#85 rainiest year since 1895)
- Precipitation compared to 1901-2000 average: 4.38 inches above norm

#34. Attala County
- Precipitation over the past year: 64.05 inches (#113 rainiest year since 1895)
- Precipitation compared to 1901-2000 average: 10.87 inches above norm

#33. Lincoln County
- Precipitation over the past year: 71.98 inches (#118 rainiest year since 1895)
- Precipitation compared to 1901-2000 average: 13.33 inches above norm

#32. Newton County
- Precipitation over the past year: 65.74 inches (#112 rainiest year since 1895)
- Precipitation compared to 1901-2000 average: 9.36 inches above norm
#31. Hinds County
- Precipitation over the past year: 71.46 inches (#126 rainiest year since 1895)
- Precipitation compared to 1901-2000 average: 18.39 inches above norm

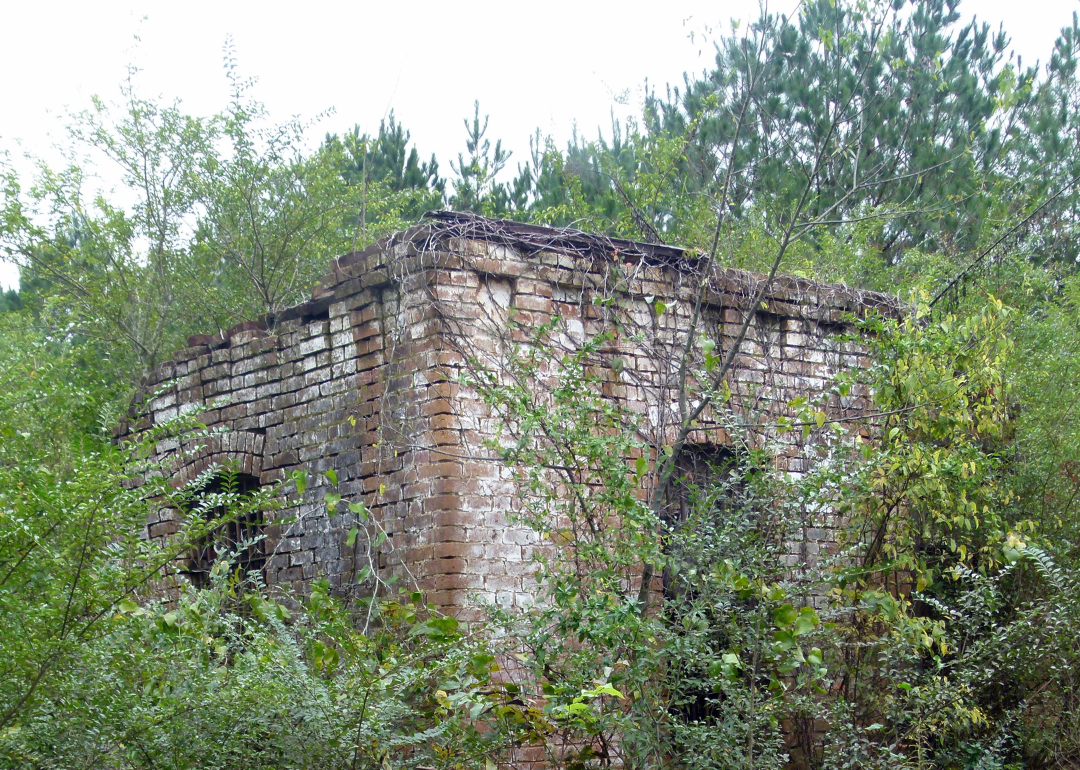
#30. Franklin County
- Precipitation over the past year: 75.23 inches (#124 rainiest year since 1895)
- Precipitation compared to 1901-2000 average: 16.56 inches above norm

#29. Covington County
- Precipitation over the past year: 68.18 inches (#107 rainiest year since 1895)
- Precipitation compared to 1901-2000 average: 10.59 inches above norm

#28. Lawrence County
- Precipitation over the past year: 67.63 inches (#111 rainiest year since 1895)
- Precipitation compared to 1901-2000 average: 9.66 inches above norm

#27. Itawamba County
- Precipitation over the past year: 55.48 inches (#72 rainiest year since 1895)
- Precipitation compared to 1901-2000 average: 1.78 inches above norm
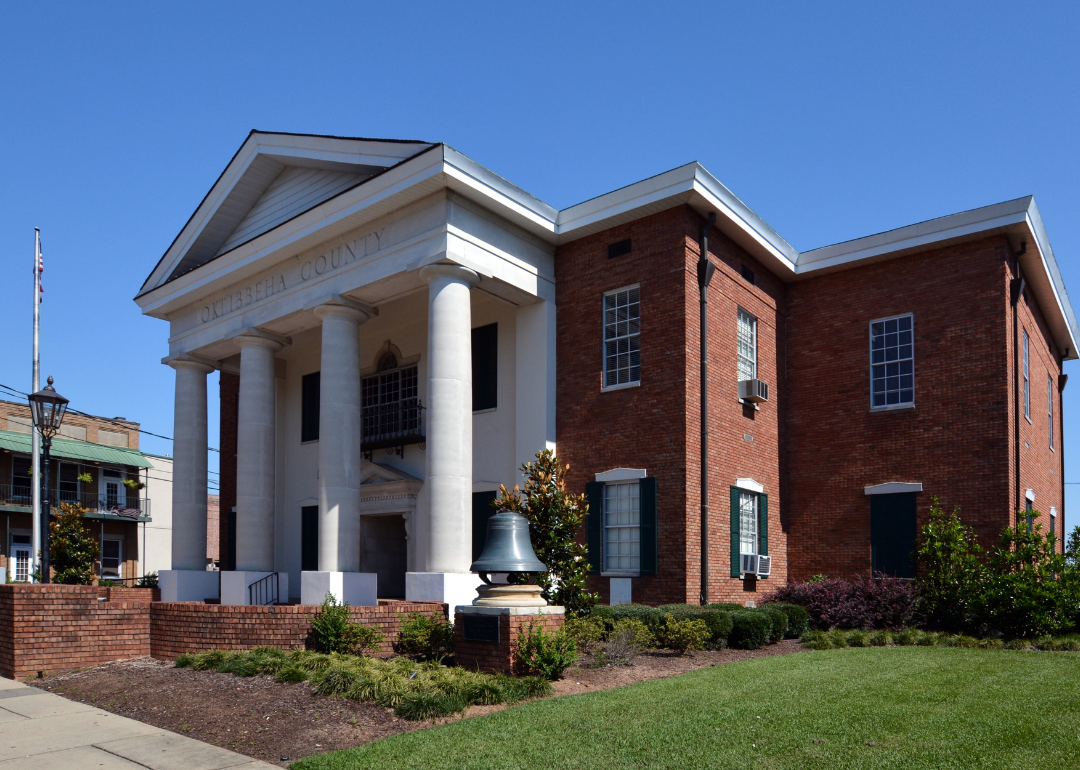
#26. Oktibbeha County
- Precipitation over the past year: 61.46 inches (#102 rainiest year since 1895)
- Precipitation compared to 1901-2000 average: 8.69 inches above norm

#25. Simpson County
- Precipitation over the past year: 70.63 inches (#118 rainiest year since 1895)
- Precipitation compared to 1901-2000 average: 14.32 inches above norm
#24. Jasper County
- Precipitation over the past year: 66.72 inches (#106 rainiest year since 1895)
- Precipitation compared to 1901-2000 average: 8.74 inches above norm
#23. Leake County
- Precipitation over the past year: 69.18 inches (#119 rainiest year since 1895)
- Precipitation compared to 1901-2000 average: 14.99 inches above norm

#22. Smith County
- Precipitation over the past year: 69.42 inches (#116 rainiest year since 1895)
- Precipitation compared to 1901-2000 average: 12.55 inches above norm

#21. Jones County
- Precipitation over the past year: 69.08 inches (#109 rainiest year since 1895)
- Precipitation compared to 1901-2000 average: 10.72 inches above norm

#20. Rankin County
- Precipitation over the past year: 73.12 inches (#126 rainiest year since 1895)
- Precipitation compared to 1901-2000 average: 19.35 inches above norm

#19. Tishomingo County
- Precipitation over the past year: 52.55 inches (#54 rainiest year since 1895)
- Precipitation compared to 1901-2000 average: -1.63 inches below norm

#18. Clarke County
- Precipitation over the past year: 65.87 inches (#98 rainiest year since 1895)
- Precipitation compared to 1901-2000 average: 8.12 inches above norm

#17. Pike County
- Precipitation over the past year: 71.54 inches (#112 rainiest year since 1895)
- Precipitation compared to 1901-2000 average: 10.01 inches above norm

#16. Jackson County
- Precipitation over the past year: 64.52 inches (#70 rainiest year since 1895)
- Precipitation compared to 1901-2000 average: 1.52 inches above norm
#15. Harrison County
- Precipitation over the past year: 61.08 inches (#58 rainiest year since 1895)
- Precipitation compared to 1901-2000 average: -1.72 inches below norm

#14. Hancock County
- Precipitation over the past year: 59.99 inches (#52 rainiest year since 1895)
- Precipitation compared to 1901-2000 average: -2.56 inches below norm
#13. Jefferson Davis County
- Precipitation over the past year: 68.36 inches (#106 rainiest year since 1895)
- Precipitation compared to 1901-2000 average: 10.05 inches above norm

#12. Scott County
- Precipitation over the past year: 71.92 inches (#122 rainiest year since 1895)
- Precipitation compared to 1901-2000 average: 17.06 inches above norm

#11. George County
- Precipitation over the past year: 69.09 inches (#89 rainiest year since 1895)
- Precipitation compared to 1901-2000 average: 5.14 inches above norm

#10. Amite County
- Precipitation over the past year: 80.20 inches (#125 rainiest year since 1895)
- Precipitation compared to 1901-2000 average: 18.71 inches above norm

#9. Greene County
- Precipitation over the past year: 72.03 inches (#106 rainiest year since 1895)
- Precipitation compared to 1901-2000 average: 10.50 inches above norm

#8. Forrest County
- Precipitation over the past year: 71.95 inches (#113 rainiest year since 1895)
- Precipitation compared to 1901-2000 average: 11.97 inches above norm

#7. Lamar County
- Precipitation over the past year: 72.07 inches (#110 rainiest year since 1895)
- Precipitation compared to 1901-2000 average: 11.83 inches above norm

#6. Marion County
- Precipitation over the past year: 69.62 inches (#102 rainiest year since 1895)
- Precipitation compared to 1901-2000 average: 9.39 inches above norm

#5. Walthall County
- Precipitation over the past year: 70.44 inches (#105 rainiest year since 1895)
- Precipitation compared to 1901-2000 average: 9.05 inches above norm
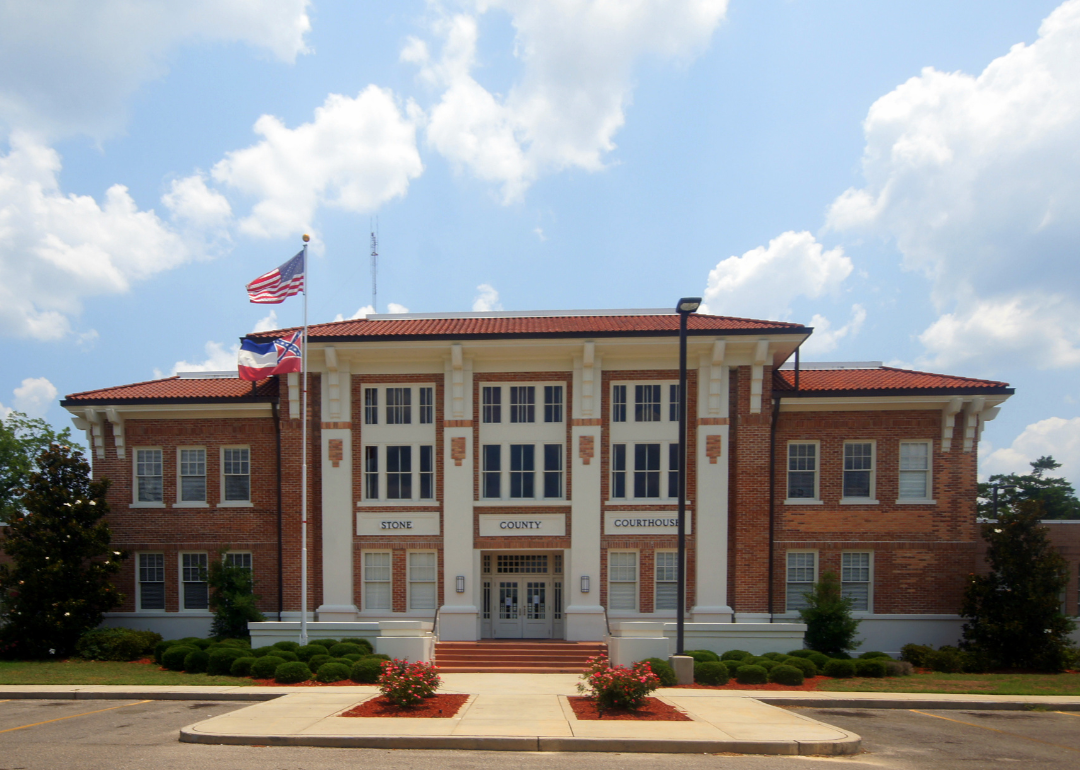
#4. Stone County
- Precipitation over the past year: 68.60 inches (#89 rainiest year since 1895)
- Precipitation compared to 1901-2000 average: 5.58 inches above norm

#3. Pearl River County
- Precipitation over the past year: 71.46 inches (#102 rainiest year since 1895)
- Precipitation compared to 1901-2000 average: 9.47 inches above norm

#2. Perry County
- Precipitation over the past year: 72.28 inches (#108 rainiest year since 1895)
- Precipitation compared to 1901-2000 average: 11.25 inches above norm

#1. Wayne County
- Precipitation over the past year: 71.88 inches (#110 rainiest year since 1895)
- Precipitation compared to 1901-2000 average: 12.66 inches above norm