
Wettest counties in Minnesota
Rain, sleet, snow, hail, wintry mix. Precipitation takes on many forms, and the degree to which climate change affects precipitation levels comes down to something almost everyone learns about in school—Earth's water cycle. A system in endless motion, the water cycle traces the process through which water exists in its three primary phases—liquid, solid, and gas—as it moves perpetually between the Earth and its atmosphere.
Increases in precipitation frequency and intensity are markers of climate change. When temperatures rise and oceans grow warmer, the amount of water that evaporates into the atmosphere—and the speed at which it does so—also increases. As atmospheric circulation carries the moisture-rich air over land or pushes it into a storm system, heavy rain or snow is often the result.
The continental U.S. on average received about 30 inches of precipitation between March 2022 and February 2023. Traditionally "wet" regions—such as Washington state and Alaska in the northwest and Georgia and Mississippi in the southeast—continue to have some of the rainiest counties in the United States. Other areas such as Oklahoma, Kansas, and Nebraska, as well as pockets of the South and of California, experience the opposite extreme: drought, also largely a product of climate change.
Stacker cited data from the National Centers for Environmental Information to identify the counties in Minnesota that receive the most precipitation through rain, sleet, or snow. Counties are ranked by five-year precipitation averages in inches as of February 2023 with rainfall over the past year serving as a tiebreaker. Supplementary data on how last year's precipitation compares to the 100-year average for the area is also included.

#50. Renville County
- Precipitation over the past year: 23.10 inches (#30 rainiest year since 1895)
- Precipitation compared to 1901-2000 average: -3.34 inches below norm

#49. Chippewa County
- Precipitation over the past year: 24.65 inches (#67 rainiest year since 1895)
- Precipitation compared to 1901-2000 average: -0.07 inches below norm

#48. Hennepin County
- Precipitation over the past year: 24.97 inches (#25 rainiest year since 1895)
- Precipitation compared to 1901-2000 average: -4.03 inches below norm

#47. Todd County
- Precipitation over the past year: 28.46 inches (#93 rainiest year since 1895)
- Precipitation compared to 1901-2000 average: 3.40 inches above norm
#46. Crow Wing County
- Precipitation over the past year: 30.12 inches (#101 rainiest year since 1895)
- Precipitation compared to 1901-2000 average: 4.38 inches above norm

#45. Stearns County
- Precipitation over the past year: 29.50 inches (#96 rainiest year since 1895)
- Precipitation compared to 1901-2000 average: 4.08 inches above norm

#44. Morrison County
- Precipitation over the past year: 29.54 inches (#93 rainiest year since 1895)
- Precipitation compared to 1901-2000 average: 3.67 inches above norm

#43. Carver County
- Precipitation over the past year: 23.55 inches (#21 rainiest year since 1895)
- Precipitation compared to 1901-2000 average: -5.00 inches below norm

#42. Rock County
- Precipitation over the past year: 21.65 inches (#22 rainiest year since 1895)
- Precipitation compared to 1901-2000 average: -4.39 inches below norm

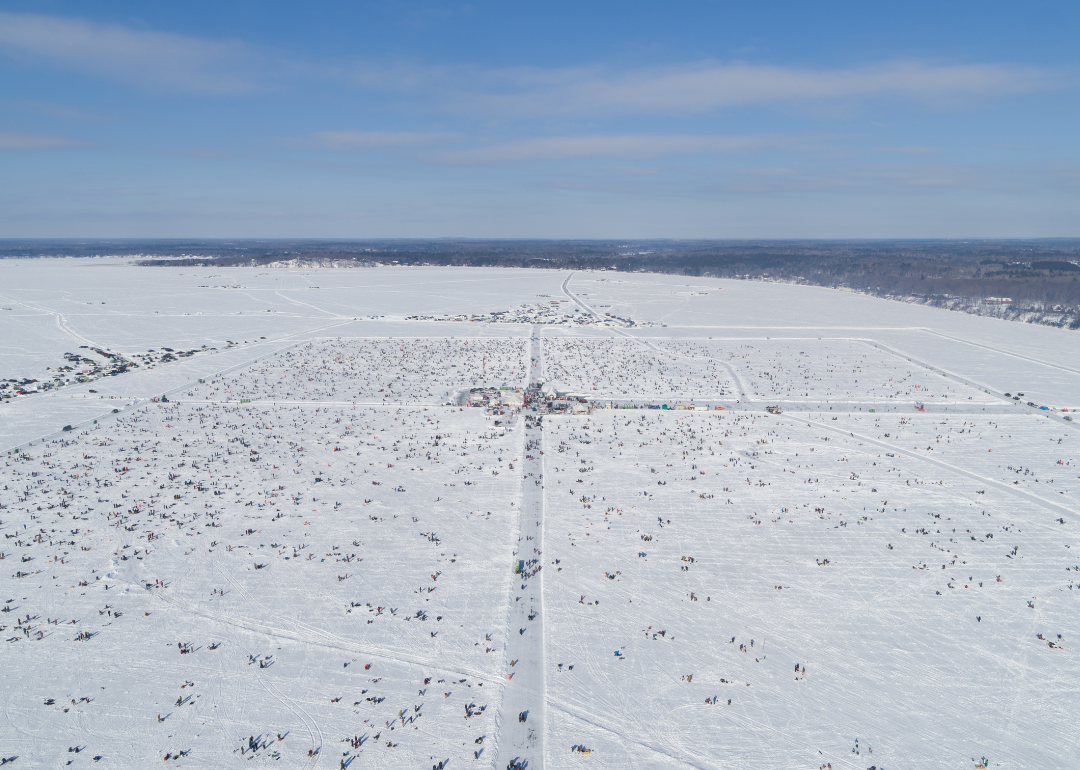
#41. Mille Lacs County
- Precipitation over the past year: 30.56 inches (#84 rainiest year since 1895)
- Precipitation compared to 1901-2000 average: 3.05 inches above norm

#40. Pipestone County
- Precipitation over the past year: 20.76 inches (#20 rainiest year since 1895)
- Precipitation compared to 1901-2000 average: -4.24 inches below norm

#39. Chisago County
- Precipitation over the past year: 30.03 inches (#72 rainiest year since 1895)
- Precipitation compared to 1901-2000 average: 0.75 inches above norm

#38. Ramsey County
- Precipitation over the past year: 26.36 inches (#37 rainiest year since 1895)
- Precipitation compared to 1901-2000 average: -2.77 inches below norm

#37. Yellow Medicine County
- Precipitation over the past year: 25.97 inches (#76 rainiest year since 1895)
- Precipitation compared to 1901-2000 average: 1.33 inches above norm

#36. Nicollet County
- Precipitation over the past year: 23.93 inches (#19 rainiest year since 1895)
- Precipitation compared to 1901-2000 average: -5.04 inches below norm

#35. Lake County
- Precipitation over the past year: 37.16 inches (#127 rainiest year since 1895)
- Precipitation compared to 1901-2000 average: 8.53 inches above norm

#34. Benton County
- Precipitation over the past year: 32.47 inches (#107 rainiest year since 1895)
- Precipitation compared to 1901-2000 average: 5.77 inches above norm
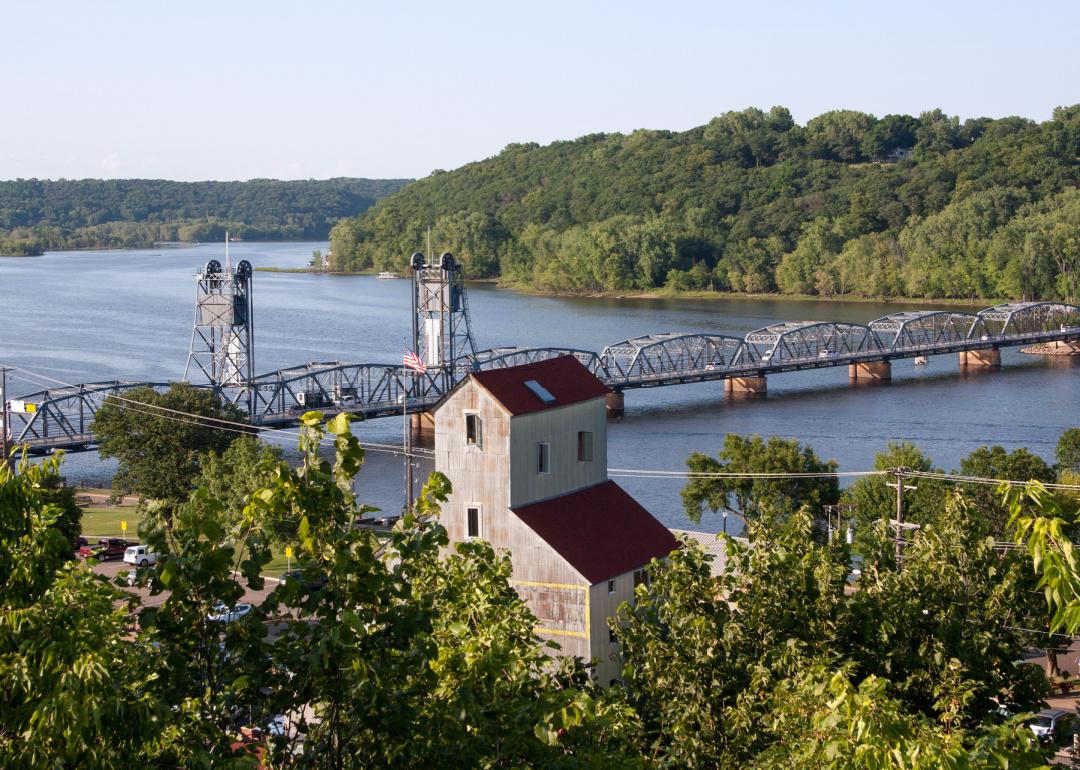
#33. Washington County
- Precipitation over the past year: 27.84 inches (#46 rainiest year since 1895)
- Precipitation compared to 1901-2000 average: -1.61 inches below norm

#32. Aitkin County
- Precipitation over the past year: 31.99 inches (#108 rainiest year since 1895)
- Precipitation compared to 1901-2000 average: 5.02 inches above norm

#31. Lincoln County
- Precipitation over the past year: 25.71 inches (#77 rainiest year since 1895)
- Precipitation compared to 1901-2000 average: 1.14 inches above norm
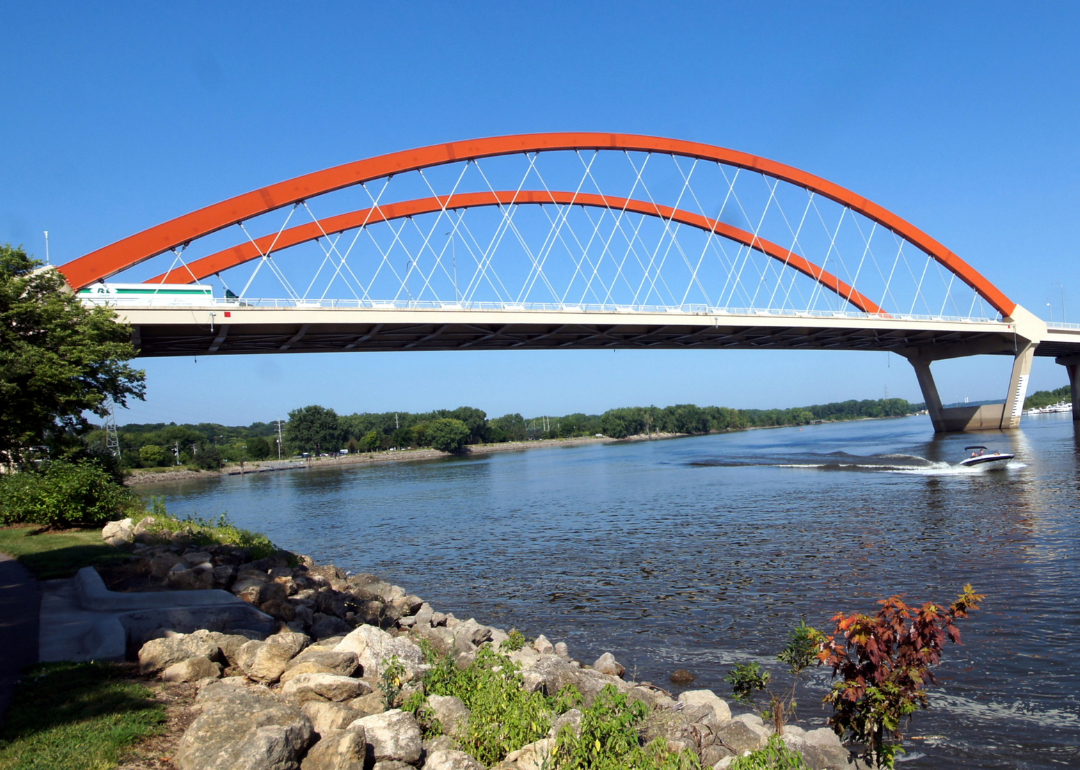
#30. Dakota County
- Precipitation over the past year: 25.91 inches (#34 rainiest year since 1895)
- Precipitation compared to 1901-2000 average: -3.42 inches below norm

#29. Carlton County
- Precipitation over the past year: 31.78 inches (#101 rainiest year since 1895)
- Precipitation compared to 1901-2000 average: 3.80 inches above norm
#28. Redwood County
- Precipitation over the past year: 23.40 inches (#41 rainiest year since 1895)
- Precipitation compared to 1901-2000 average: -2.53 inches below norm

#27. Cook County
- Precipitation over the past year: 38.23 inches (#123 rainiest year since 1895)
- Precipitation compared to 1901-2000 average: 8.94 inches above norm

#26. Scott County
- Precipitation over the past year: 24.30 inches (#27 rainiest year since 1895)
- Precipitation compared to 1901-2000 average: -4.65 inches below norm

#25. Lyon County
- Precipitation over the past year: 24.72 inches (#64 rainiest year since 1895)
- Precipitation compared to 1901-2000 average: -0.12 inches below norm

#24. Kanabec County
- Precipitation over the past year: 32.11 inches (#96 rainiest year since 1895)
- Precipitation compared to 1901-2000 average: 4.19 inches above norm

#23. Murray County
- Precipitation over the past year: 20.29 inches (#15 rainiest year since 1895)
- Precipitation compared to 1901-2000 average: -5.76 inches below norm
#22. Brown County
- Precipitation over the past year: 24.61 inches (#35 rainiest year since 1895)
- Precipitation compared to 1901-2000 average: -3.23 inches below norm
#21. Nobles County
- Precipitation over the past year: 22.99 inches (#26 rainiest year since 1895)
- Precipitation compared to 1901-2000 average: -4.10 inches below norm

#20. Pine County
- Precipitation over the past year: 31.52 inches (#87 rainiest year since 1895)
- Precipitation compared to 1901-2000 average: 2.74 inches above norm

#19. Cottonwood County
- Precipitation over the past year: 23.36 inches (#32 rainiest year since 1895)
- Precipitation compared to 1901-2000 average: -3.51 inches below norm

#18. Le Sueur County
- Precipitation over the past year: 26.62 inches (#38 rainiest year since 1895)
- Precipitation compared to 1901-2000 average: -2.51 inches below norm

#17. Jackson County
- Precipitation over the past year: 26.56 inches (#54 rainiest year since 1895)
- Precipitation compared to 1901-2000 average: -0.92 inches below norm

#16. Martin County
- Precipitation over the past year: 27.49 inches (#55 rainiest year since 1895)
- Precipitation compared to 1901-2000 average: -1.13 inches below norm
#15. Goodhue County
- Precipitation over the past year: 28.83 inches (#52 rainiest year since 1895)
- Precipitation compared to 1901-2000 average: -0.97 inches below norm

#14. Faribault County
- Precipitation over the past year: 29.71 inches (#67 rainiest year since 1895)
- Precipitation compared to 1901-2000 average: 0.10 inches above norm

#13. Blue Earth County
- Precipitation over the past year: 28.55 inches (#60 rainiest year since 1895)
- Precipitation compared to 1901-2000 average: -0.30 inches below norm
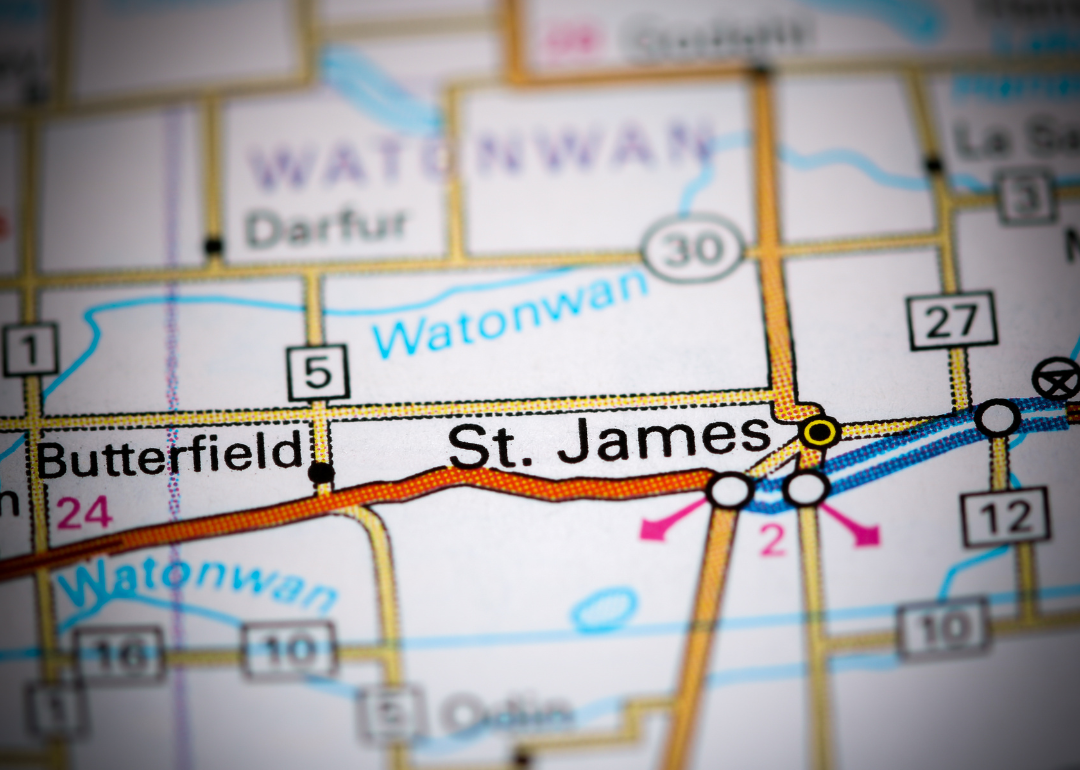
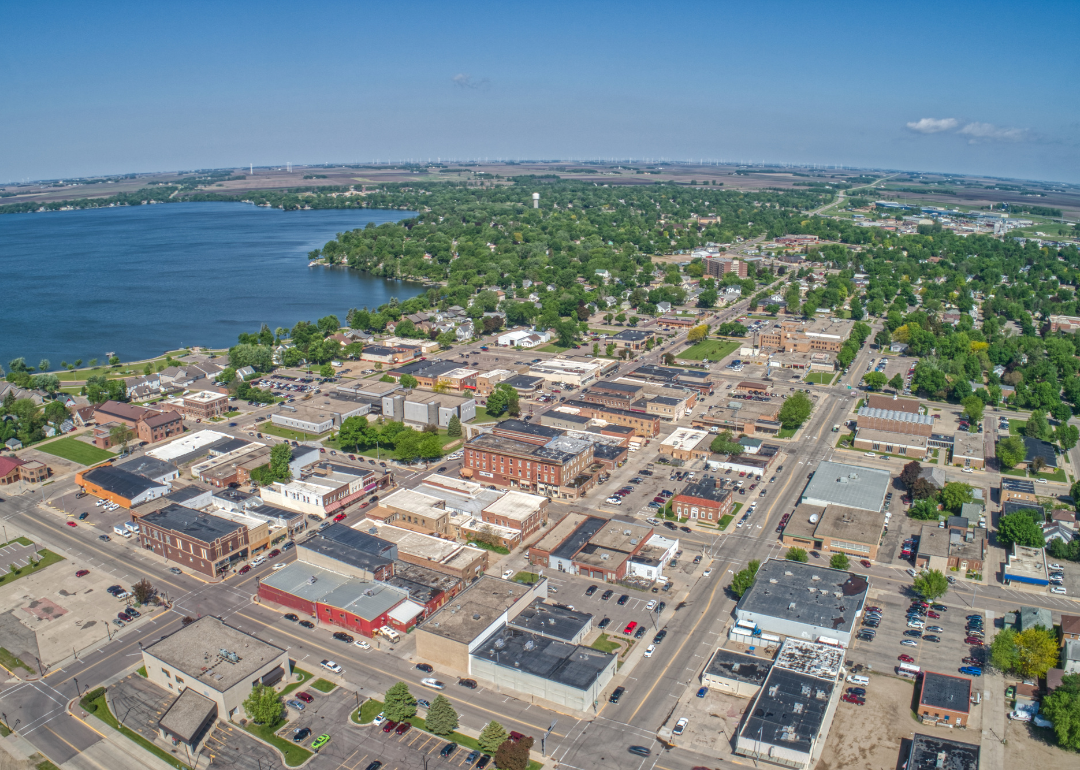
#12. Watonwan County
- Precipitation over the past year: 27.47 inches (#59 rainiest year since 1895)
- Precipitation compared to 1901-2000 average: -0.60 inches below norm
#11. Rice County
- Precipitation over the past year: 30.39 inches (#65 rainiest year since 1895)
- Precipitation compared to 1901-2000 average: 1.07 inches above norm

#10. Waseca County
- Precipitation over the past year: 32.38 inches (#84 rainiest year since 1895)
- Precipitation compared to 1901-2000 average: 3.19 inches above norm
#9. Wabasha County
- Precipitation over the past year: 30.92 inches (#67 rainiest year since 1895)
- Precipitation compared to 1901-2000 average: 0.29 inches above norm

#8. Freeborn County
- Precipitation over the past year: 31.67 inches (#72 rainiest year since 1895)
- Precipitation compared to 1901-2000 average: 0.85 inches above norm

#7. Steele County
- Precipitation over the past year: 34.10 inches (#94 rainiest year since 1895)
- Precipitation compared to 1901-2000 average: 4.47 inches above norm

#6. Dodge County
- Precipitation over the past year: 34.42 inches (#90 rainiest year since 1895)
- Precipitation compared to 1901-2000 average: 4.17 inches above norm

#5. Mower County
- Precipitation over the past year: 35.94 inches (#94 rainiest year since 1895)
- Precipitation compared to 1901-2000 average: 4.30 inches above norm

#4. Olmsted County
- Precipitation over the past year: 36.32 inches (#100 rainiest year since 1895)
- Precipitation compared to 1901-2000 average: 5.37 inches above norm

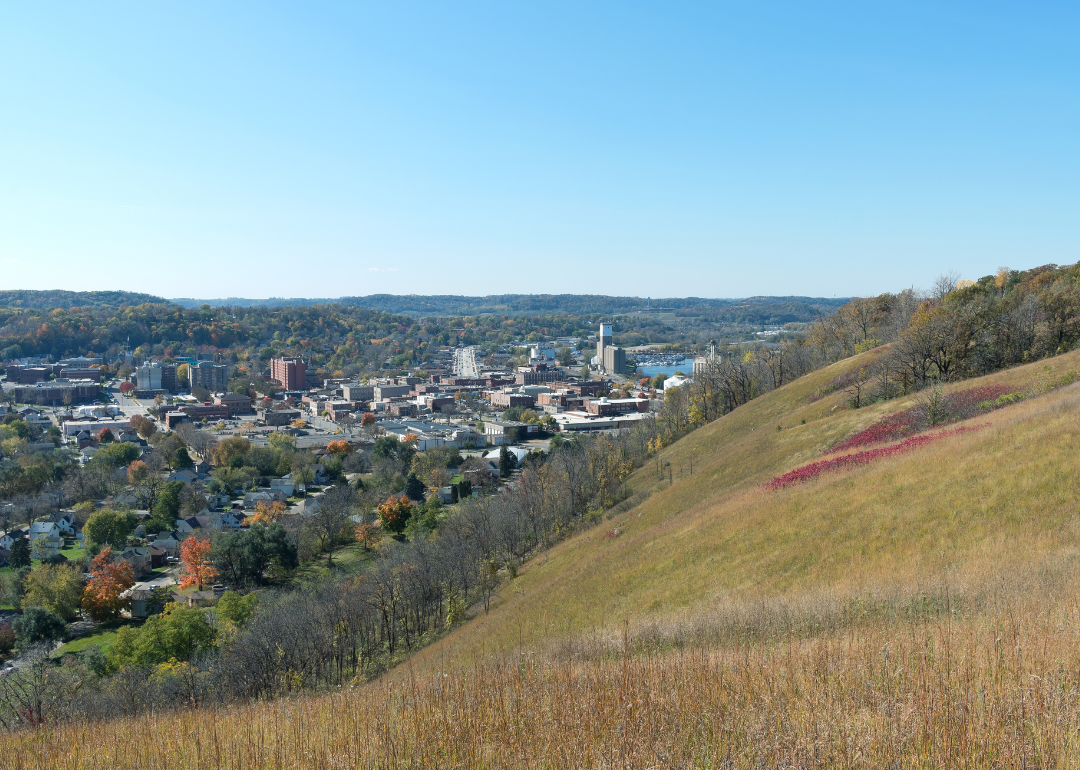
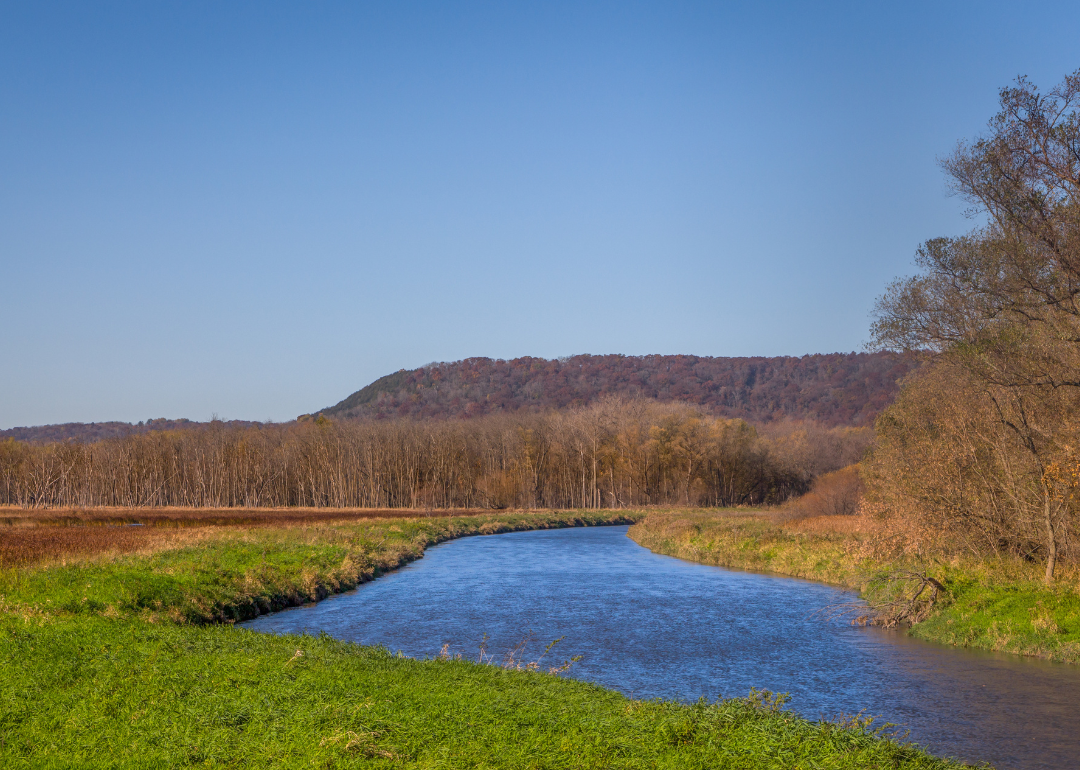
#3. Winona County
- Precipitation over the past year: 36.92 inches (#99 rainiest year since 1895)
- Precipitation compared to 1901-2000 average: 5.05 inches above norm

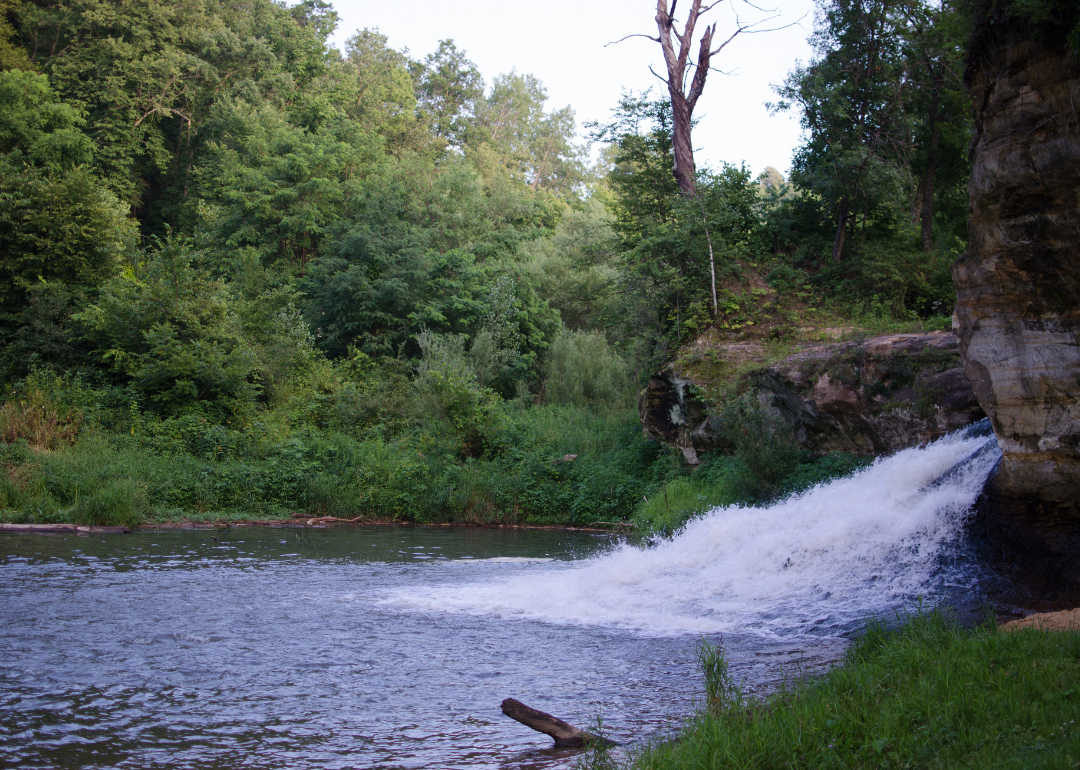
#2. Fillmore County
- Precipitation over the past year: 39.96 inches (#112 rainiest year since 1895)
- Precipitation compared to 1901-2000 average: 7.94 inches above norm
#1. Houston County
- Precipitation over the past year: 38.01 inches (#105 rainiest year since 1895)
- Precipitation compared to 1901-2000 average: 5.74 inches above norm


