
Counties with the most bridges in dire need of repair in Massachusetts
Counties with the most bridges in dire need of repair in Massachusetts
One in three U.S. bridges is in need of repair or replacement, according to data from the American Road & Transportation Builders Association, including 29% of interstate bridges. The cost to make these repairs is estimated to be in excess of $54 billion.
Stacker investigated which counties in Massachusetts have the most bridges in dire need of repair using data from the Federal Highway Administration. The data is accurate as of June 15, 2022. Counties are ranked by percent of bridges in "poor" condition and ties are broken by percent square meters of bridges in poor condition. Counties that have no bridges or have no bridges in poor condition are excluded from the list.
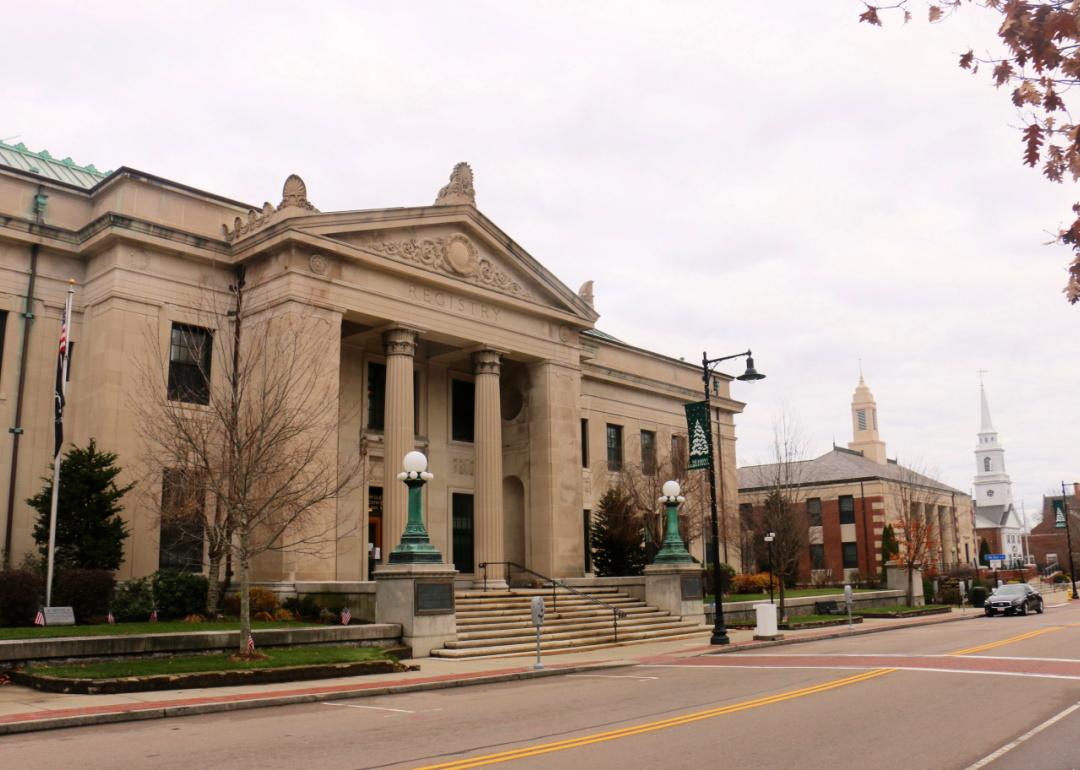
#12. Norfolk County
- Bridges in poor condition: 3.5% (12 of 342 bridges)
- Square meters of bridges in poor condition: 3.0% (6,738 of 226,701 square meters of bridges)
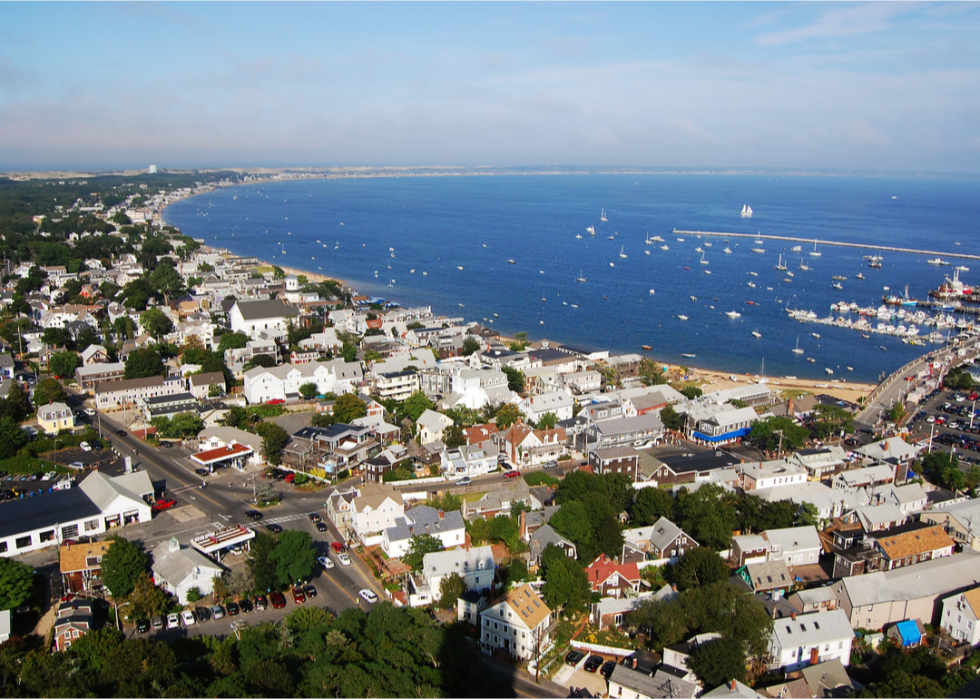
#11. Barnstable County
- Bridges in poor condition: 3.7% (4 of 107 bridges)
- Square meters of bridges in poor condition: 21.7% (14,315 of 66,024 square meters of bridges)
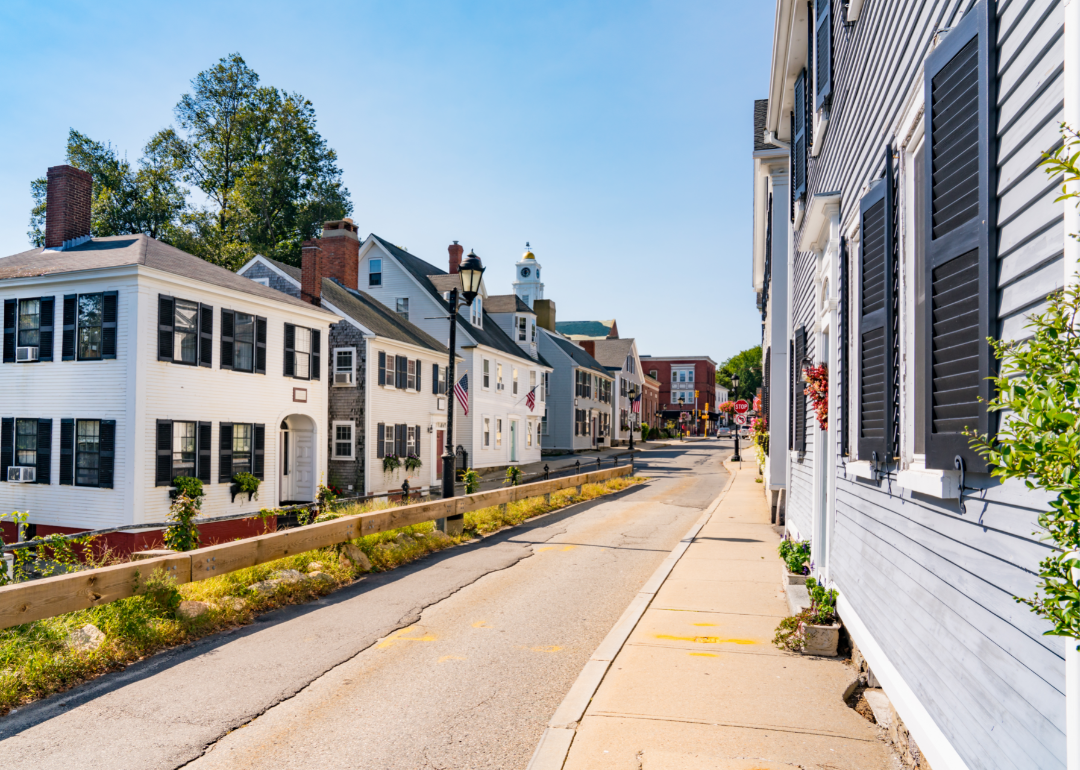
#10. Plymouth County
- Bridges in poor condition: 4.2% (12 of 287 bridges)
- Square meters of bridges in poor condition: 7.6% (11,029 of 145,941 square meters of bridges)

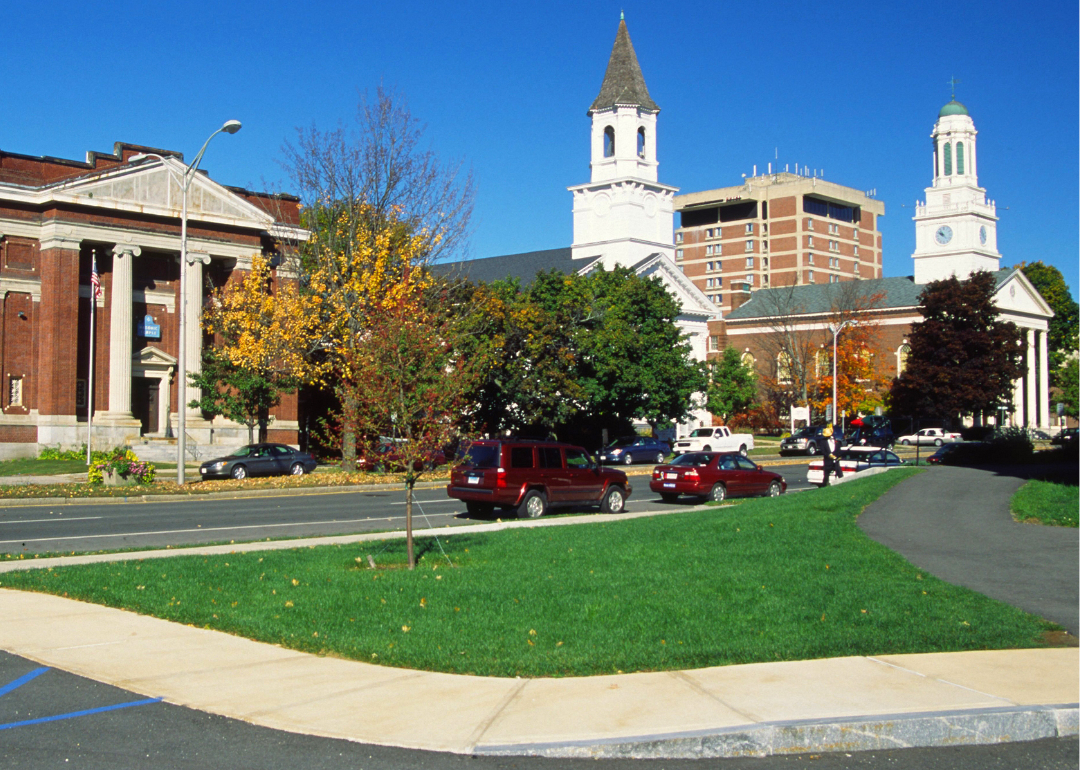
#9. Worcester County
- Bridges in poor condition: 6.5% (65 of 996 bridges)
- Square meters of bridges in poor condition: 5.4% (27,633 of 514,726 square meters of bridges)

#8. Bristol County
- Bridges in poor condition: 7.2% (28 of 389 bridges)
- Square meters of bridges in poor condition: 8.0% (27,774 of 348,811 square meters of bridges)
#7. Berkshire County
- Bridges in poor condition: 7.6% (34 of 447 bridges)
- Square meters of bridges in poor condition: 5.2% (6,488 of 125,669 square meters of bridges)
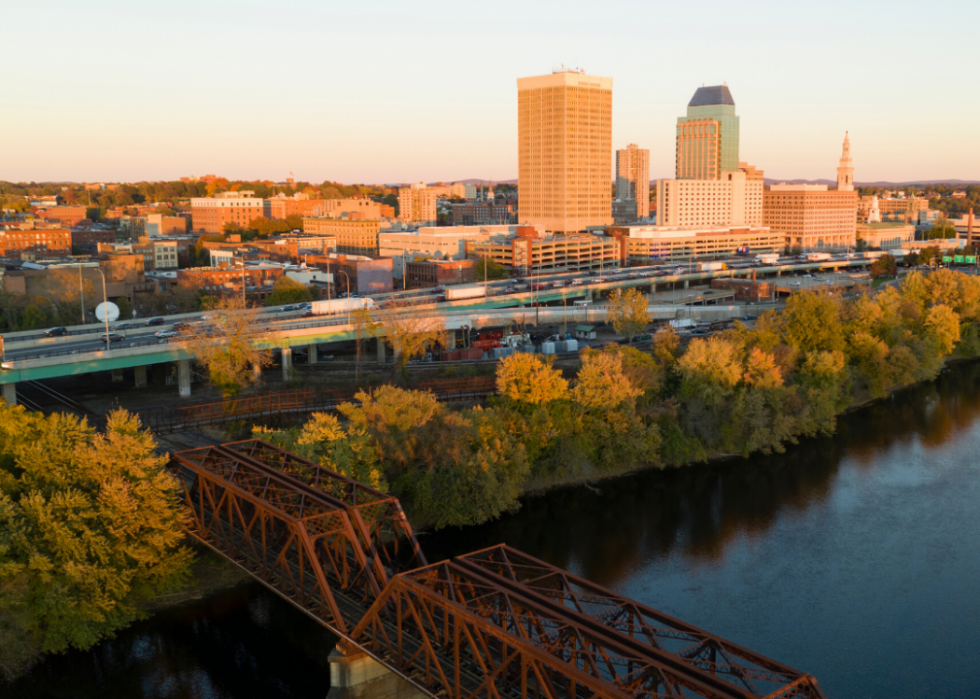
#6. Hampden County
- Bridges in poor condition: 8.4% (36 of 430 bridges)
- Square meters of bridges in poor condition: 7.4% (34,756 of 469,888 square meters of bridges)

#5. Suffolk County
- Bridges in poor condition: 10.1% (50 of 493 bridges)
- Square meters of bridges in poor condition: 11.6% (124,395 of 1,076,279 square meters of bridges)
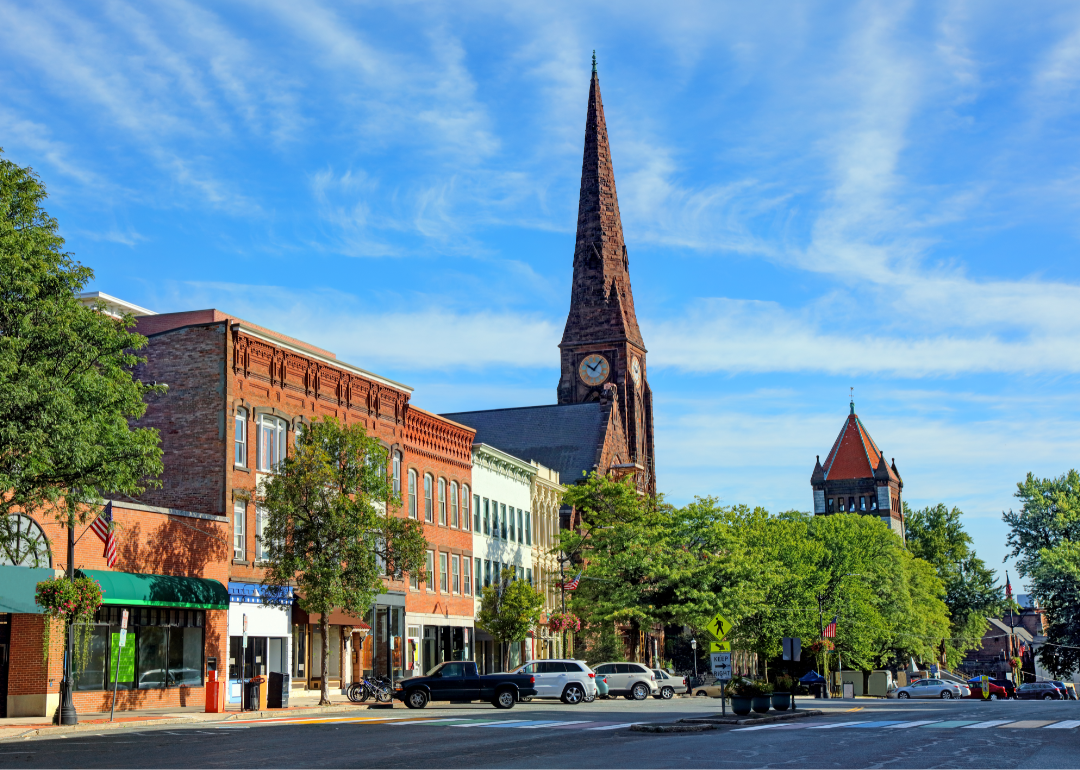
#4. Hampshire County
- Bridges in poor condition: 10.4% (27 of 259 bridges)
- Square meters of bridges in poor condition: 13.2% (11,201 of 84,721 square meters of bridges)
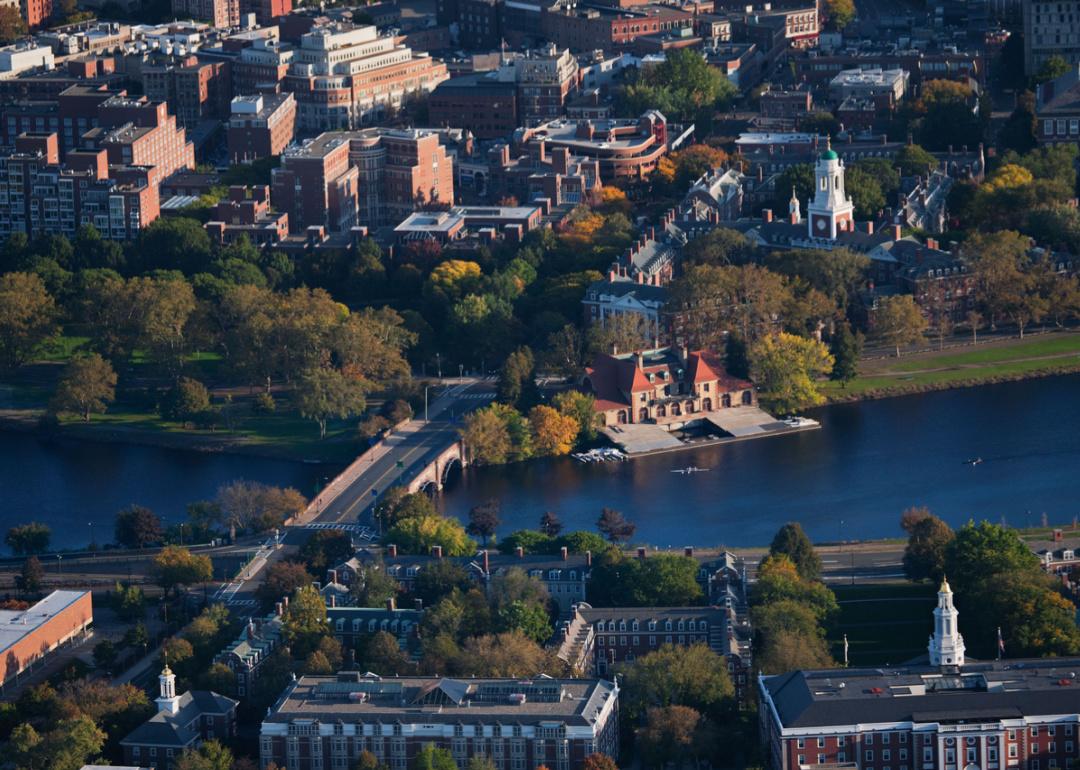
#3. Middlesex County
- Bridges in poor condition: 10.5% (83 of 793 bridges)
- Square meters of bridges in poor condition: 12.9% (76,399 of 591,724 square meters of bridges)
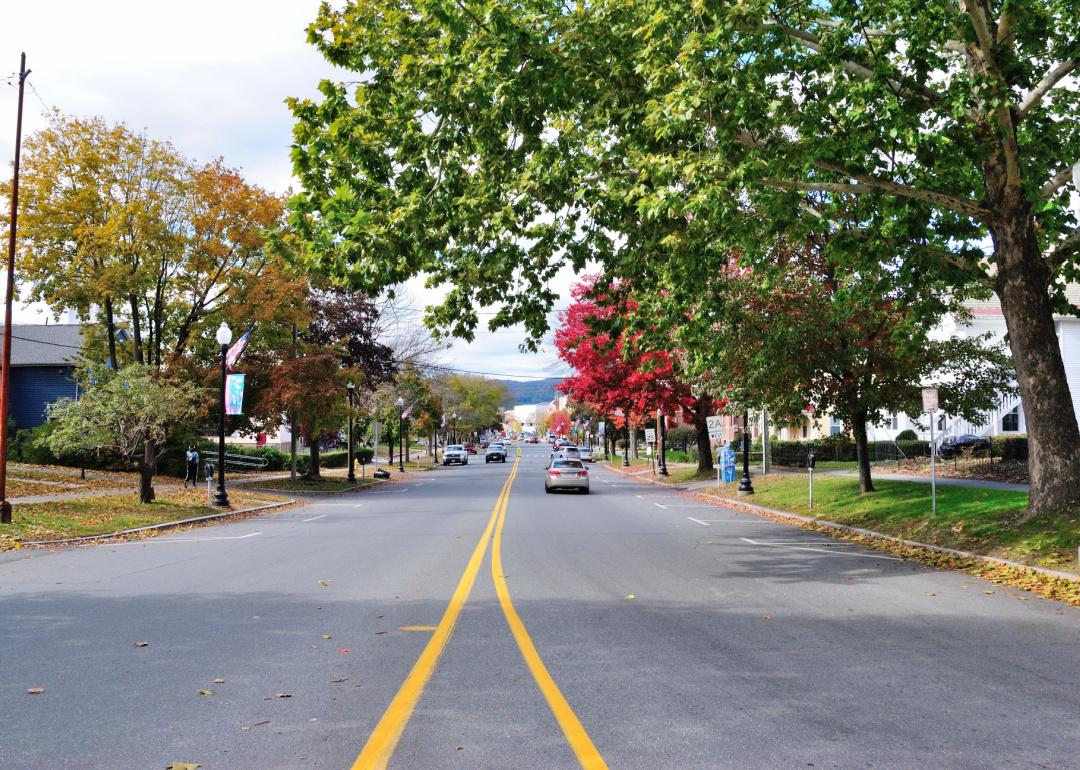
#2. Franklin County
- Bridges in poor condition: 10.7% (33 of 308 bridges)
- Square meters of bridges in poor condition: 13.1% (16,724 of 127,679 square meters of bridges)

#1. Essex County
- Bridges in poor condition: 15.3% (60 of 392 bridges)
- Square meters of bridges in poor condition: 23.8% (91,405 of 383,561 square meters of bridges)


