Counties with the most tornadoes in Kansas
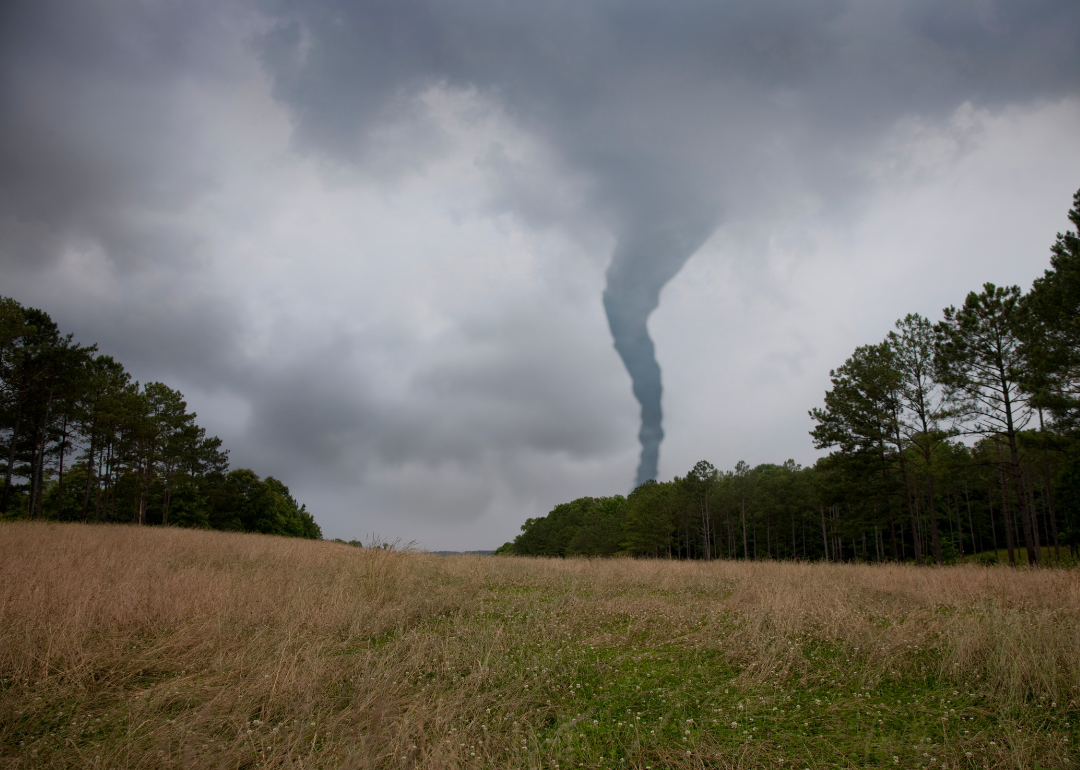
It's been a busy year for tornadoes in the U.S. According to the National Oceanic and Atmospheric Administration, as many as 1,155 twisters have touched down across the country since the start of the year, above the average for this time of year.
A single day can drive up tornado counts. March 31, 2023, accounted for 163 tornadoes across the Midwest and South. Tornado activity usually peaks in the spring and early summer, and the pace of tornadoes usually slows around late summer. A smaller-scale second tornado season emerges in the fall, mostly in the Gulf Coast states.
Stacker used data from NOAA's National Centers for Environmental Information to find the counties in Kansas that have experienced the most tornadoes since 2000. While data is available going back to 1950, tornado tracking by the National Weather Service became more robust and accurate in the 1990s. Since counties can vary in size, they are ranked by the number of tornadoes per 100 square miles. Counties that experienced less than five tornadoes are not included.
The counties that encounter the most tornadoes aren't all in the infamous Tornado Alley. When adjusted for county area, the top 10 counties that experienced the most tornadoes since 2000 are from nine different states, all in the Southeast with the exception of Cleveland County, Oklahoma.
Research has shown that Tornado Alley is shifting due to warming temperatures fueled by climate change. In the future, the Southeast could become the region that receives the bulk of the country's tornadoes. It's a concerning trend as the South is more populated than the Great Plains and has a higher concentration of mobile homes than other parts of the country, making the storms potentially deadlier and costlier.
As of August 2023, 75 people have died from tornadoes this year, and over 60% of those deaths occurred in mobile homes.
The best way to stay protected during tornadoes is to have multiple ways of receiving storm updates including social media, radio, television, and sirens, and to immediately seek shelter in a basement or interior room without windows when a tornado watch escalates to a warning.
Read on to see which counties experience the most tornadoes in Kansas.
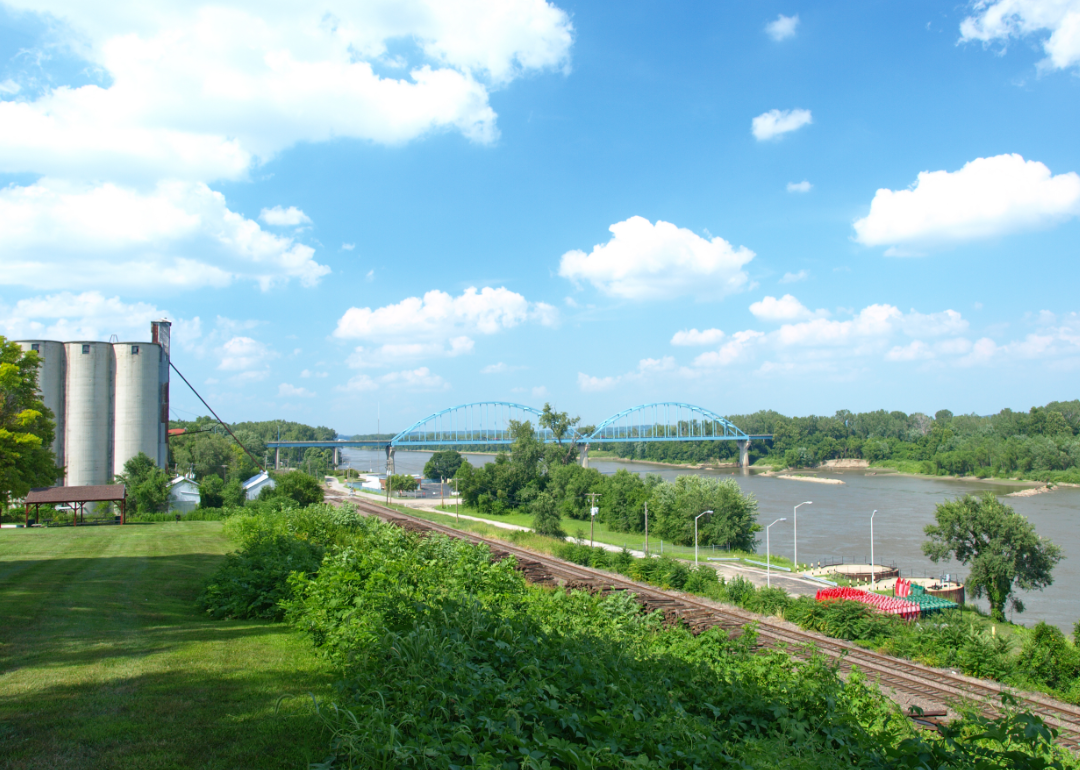
#50. Leavenworth County
- #808 nationally
- Tornadoes this year, as of May 31: 0

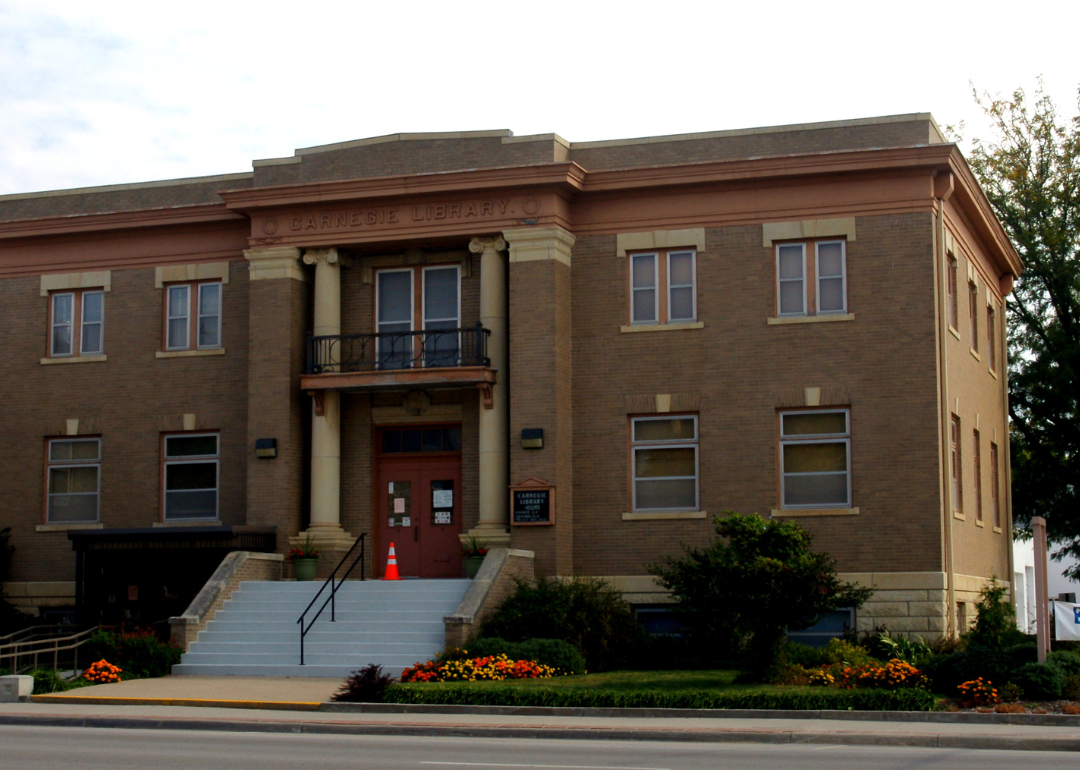
#49. Butler County
- #805 nationally
- Tornadoes this year, as of May 31: 0

#48. Shawnee County
- #796 nationally
- Tornadoes this year, as of May 31: 0

#47. Finney County
- #747 nationally
- Tornadoes this year, as of May 31: 0

#46. Thomas County
- #725 nationally
- Tornadoes this year, as of May 31: 1

#45. Osage County
- #703 nationally
- Tornadoes this year, as of May 31: 0
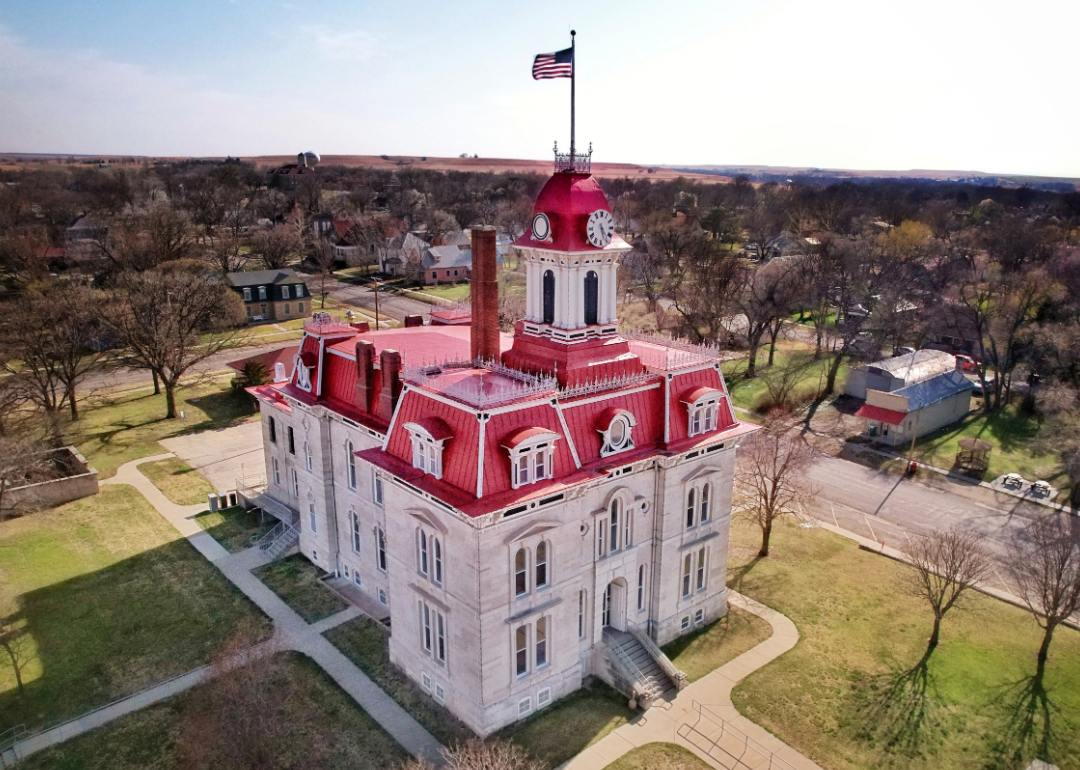
#44. Chase County
- #689 nationally
- Tornadoes this year, as of May 31: 9

#43. Geary County
- #682 nationally
- Tornadoes this year, as of May 31: 0

#42. Rice County
- #669 nationally
- Tornadoes this year, as of May 31: 0
#41. Clay County
- #658 nationally
- Tornadoes this year, as of May 31: 1

#40. Ellsworth County
- #649 nationally
- Tornadoes this year, as of May 31: 0
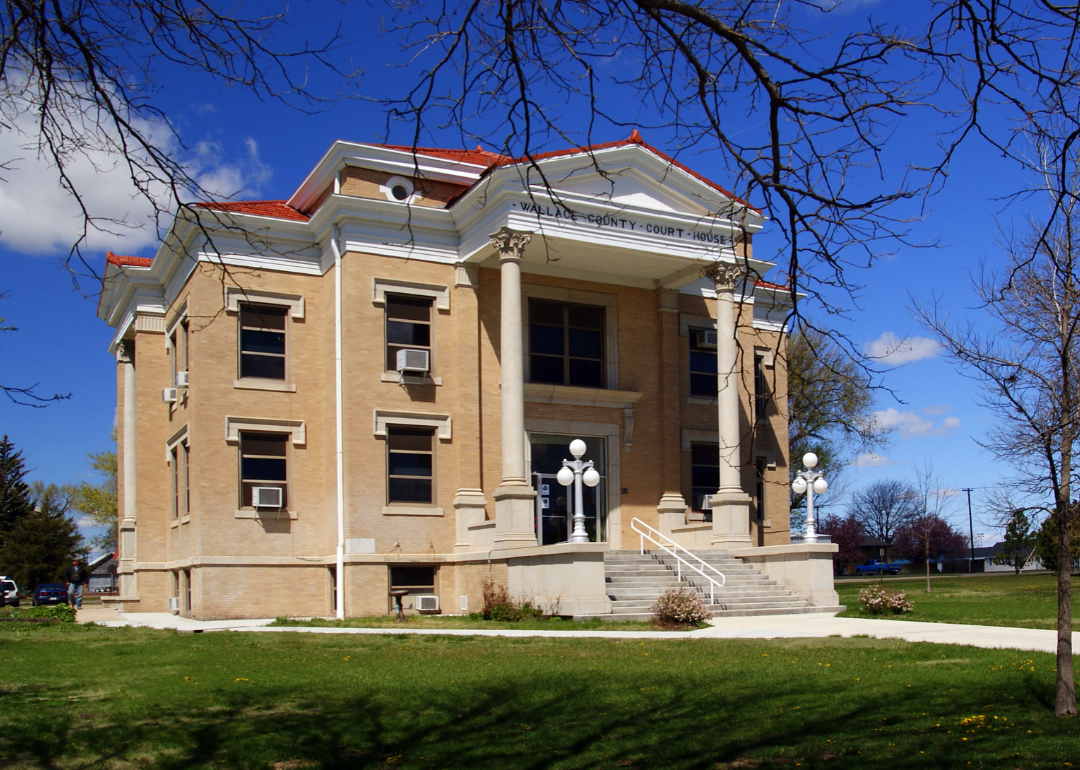
#39. Wallace County
- #619 nationally
- Tornadoes this year, as of May 31: 4

#38. Grant County
- #594 nationally
- Tornadoes this year, as of May 31: 1

#37. Pawnee County
- #593 nationally
- Tornadoes this year, as of May 31: 0

#36. Seward County
- #582 nationally
- Tornadoes this year, as of May 31: 1
#35. Cherokee County
- #547 nationally
- Tornadoes this year, as of May 31: 0

#34. Lincoln County
- #538 nationally
- Tornadoes this year, as of May 31: 0
#33. Greeley County
- #522 nationally
- Tornadoes this year, as of May 31: 0

#32. Clark County
- #506 nationally
- Tornadoes this year, as of May 31: 0

#31. Rooks County
- #488 nationally
- Tornadoes this year, as of May 31: 0

#30. Haskell County
- #456 nationally
- Tornadoes this year, as of May 31: 0
#29. Hodgeman County
- #444 nationally
- Tornadoes this year, as of May 31: 0

#28. Johnson County
- #430 nationally
- Tornadoes this year, as of May 31: 0

#27. Reno County
- #423 nationally
- Tornadoes this year, as of May 31: 0

#26. Sumner County
- #407 nationally
- Tornadoes this year, as of May 31: 0

#25. Meade County
- #391 nationally
- Tornadoes this year, as of May 31: 0
#24. Douglas County
- #386 nationally
- Tornadoes this year, as of May 31: 0

#23. Saline County
- #371 nationally
- Tornadoes this year, as of May 31: 0
#22. Comanche County
- #314 nationally
- Tornadoes this year, as of May 31: 0

#21. Ellis County
- #312 nationally
- Tornadoes this year, as of May 31: 0

#20. Scott County
- #272 nationally
- Tornadoes this year, as of May 31: 0

#19. Harper County
- #254 nationally
- Tornadoes this year, as of May 31: 0

#18. Gove County
- #243 nationally
- Tornadoes this year, as of May 31: 0

#17. Sherman County
- #235 nationally
- Tornadoes this year, as of May 31: 1
#16. Cowley County
- #220 nationally
- Tornadoes this year, as of May 31: 0

#15. Sheridan County
- #208 nationally
- Tornadoes this year, as of May 31: 1

#14. Gray County
- #206 nationally
- Tornadoes this year, as of May 31: 0

#13. Kingman County
- #186 nationally
- Tornadoes this year, as of May 31: 0

#12. Labette County
- #177 nationally
- Tornadoes this year, as of May 31: 0
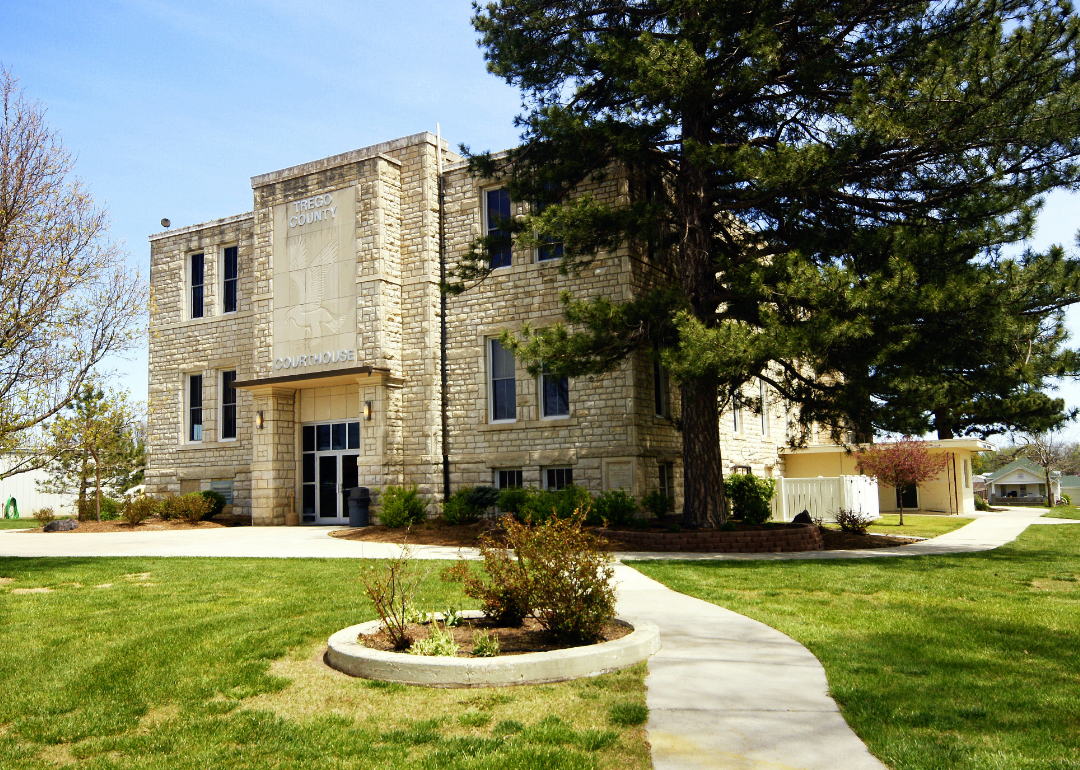
#11. Trego County
- #173 nationally
- Tornadoes this year, as of May 31: 0

#10. Lane County
- #159 nationally
- Tornadoes this year, as of May 31: 1

#9. Pratt County
- #136 nationally
- Tornadoes this year, as of May 31: 0
#8. Rush County
- #116 nationally
- Tornadoes this year, as of May 31: 0
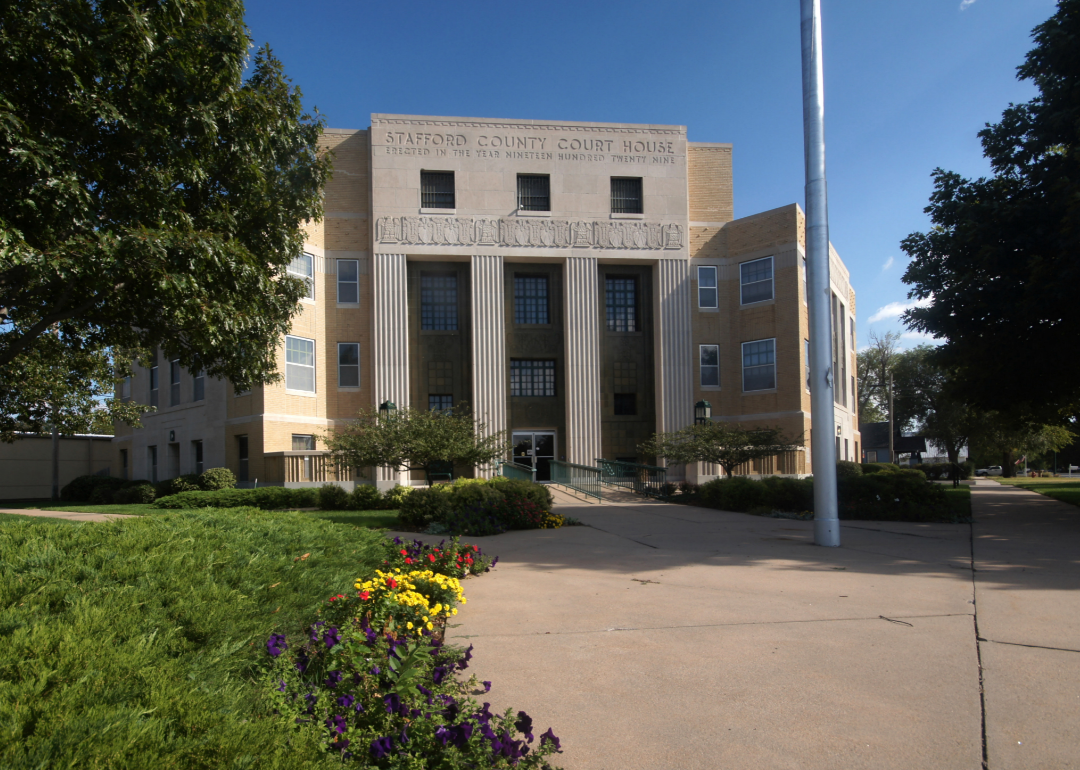
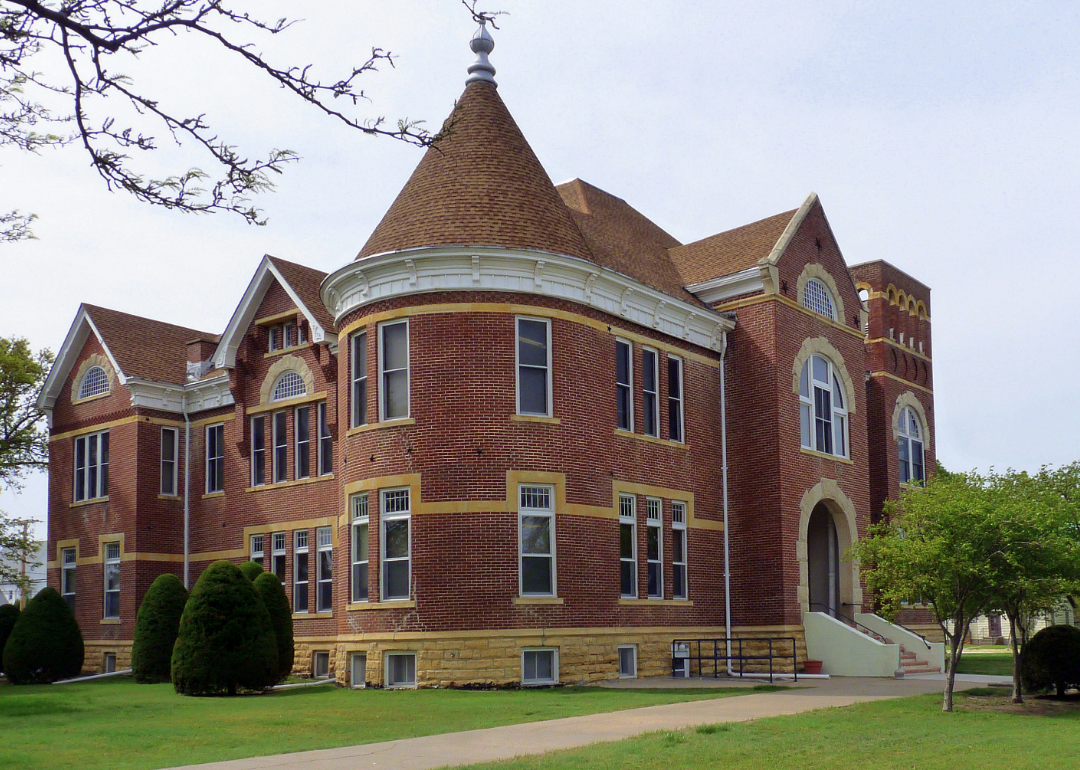
#7. Stafford County
- #112 nationally
- Tornadoes this year, as of May 31: 0

#6. Russell County
- #63 nationally
- Tornadoes this year, as of May 31: 0
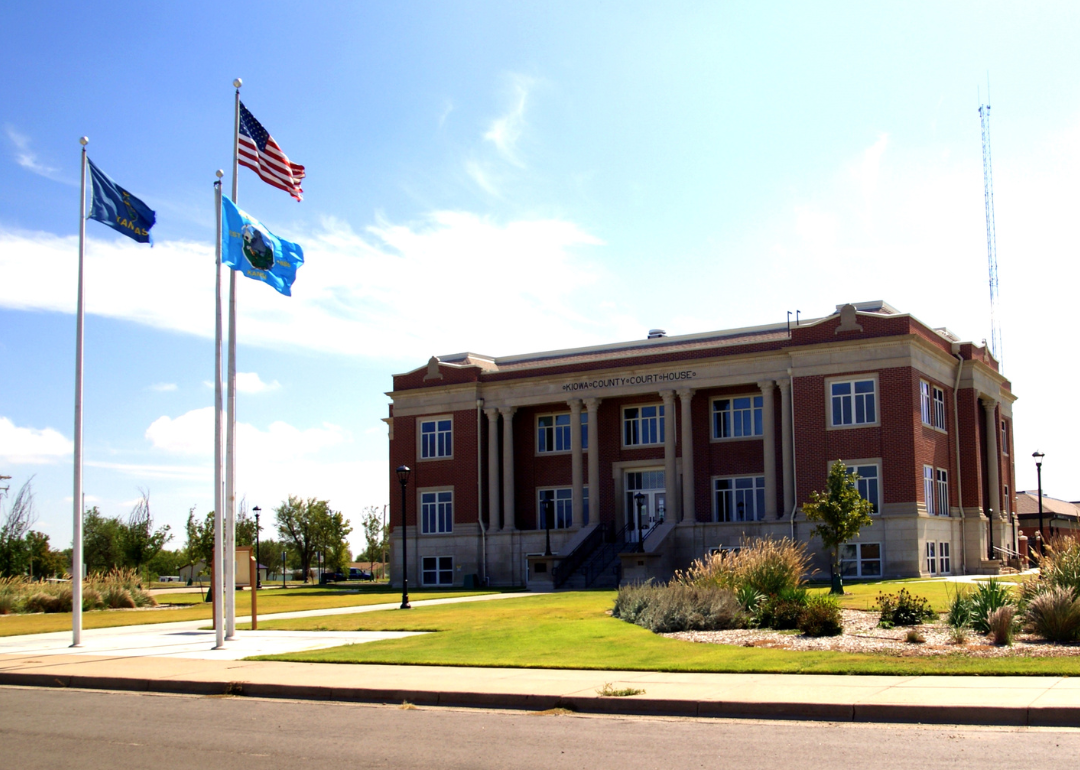
#5. Kiowa County
- #46 nationally
- Tornadoes this year, as of May 31: 0
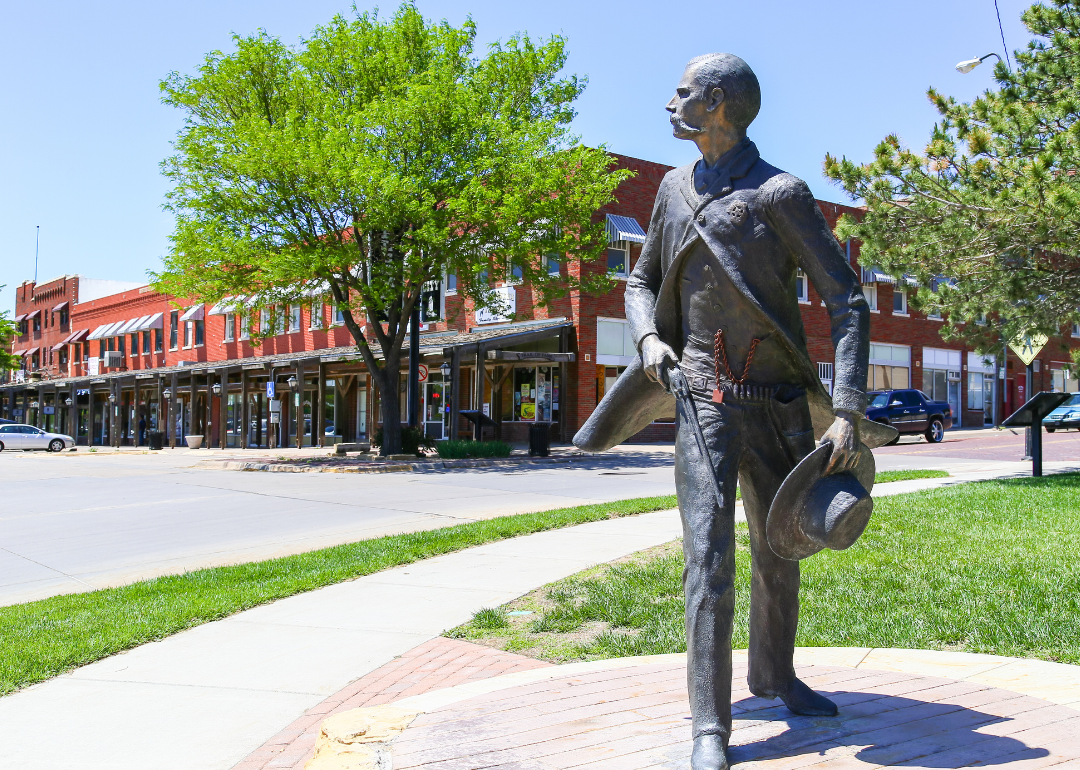
#4. Ford County
- #38 nationally
- Tornadoes this year, as of May 31: 0

#3. Edwards County
- #33 nationally
- Tornadoes this year, as of May 31: 0
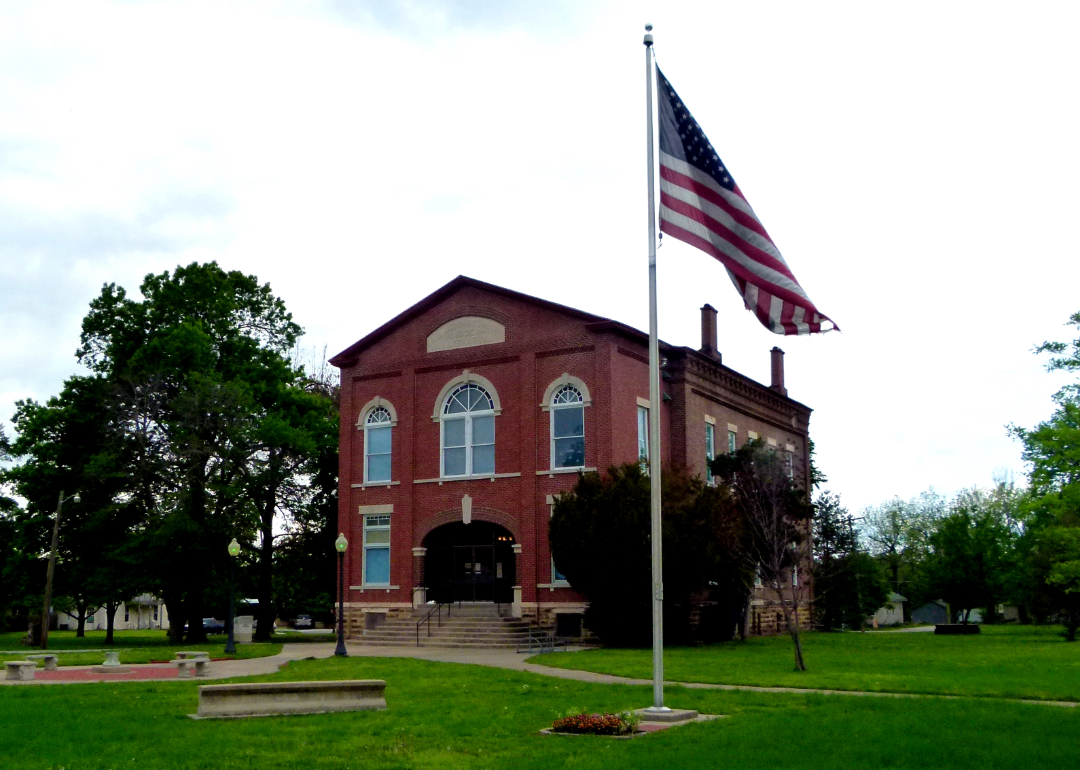
#2. Republic County
- #30 nationally
- Tornadoes this year, as of May 31: 0

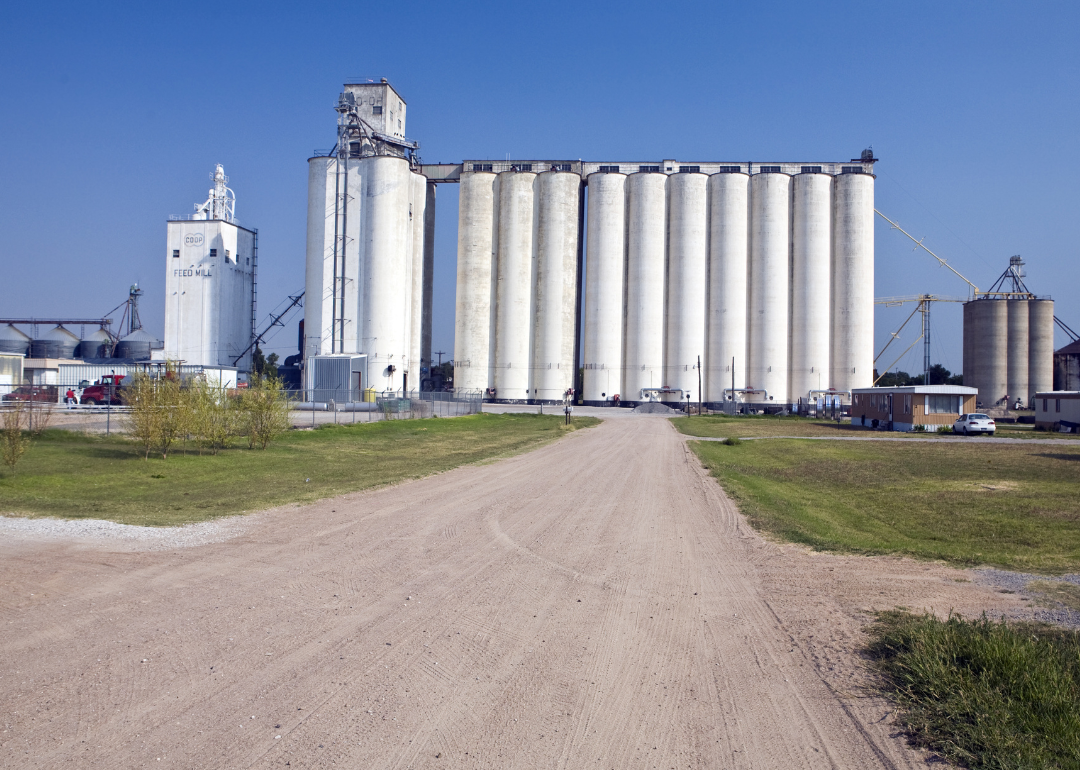
#1. Barton County
- #28 nationally
- Tornadoes this year, as of May 31: 0


