Counties where children have the best opportunity for economic mobility in Indiana
This story originally appeared on Wealth Enhancement Group and was produced and distributed in partnership with Stacker Studio.
Counties where children have the best opportunity for economic mobility in Indiana
Americans have long understood that their birthplace can significantly affect their futures, and academics have increasingly been able to connect tangible early life factors like where they live and the friendships they've cultivated with potential future income.
Among the most recent studies shedding light on what's known as economic mobility—a person's ability to move themselves and their families up the socioeconomic ladder over their lifetime—are a series of papers authored by Harvard University researchers leveraging vast troves of social networking data.
As part of a national analysis, Wealth Enhancement Group used data from Harvard University's Social Capital Atlas project to identify where in Indiana children have the best (and worst) chances at upward economic mobility.
The research draws on a privacy-protected dataset representing 21 billion friendships from Facebook made public through its parent company Meta's Data for Good project. It also uses anonymous tax records, according to the authors. The scholars assigned a score to locales according to how economically connected low- and high-income people living in the area have historically been over at least a decade, per that data. The dataset does not include scores for about 180 of the 3,000 or so counties in the U.S.
The research attempts to fill in the gaps of previous efforts to study American economic mobility that did not consider a person's vast social networks nor their importance in creating better lives for themselves and their children.
It turns out the ability to cultivate friendships linking people of different socioeconomic backgrounds with one another is the strongest factor in determining whether a child can surpass the earning potential of their parents, Harvard researchers found. They call this economic connectedness.
Read on to find out where economic connectedness is strongest in your state.
#50. Steuben County
- Median Income: $61,698
- Population: 34,379
--- 95% white
--- 0.3% Black
--- 0% American Indian and Alaska Native
--- 0.7% Asian
#49. Newton County
- Median Income: $62,306
- Population: 13,865
--- 92.8% white
--- 1.1% Black
--- 0.1% American Indian and Alaska Native
--- 0.2% Asian

#48. Vermillion County
- Median Income: $53,396
- Population: 15,477
--- 96.6% white
--- 0.4% Black
--- 0.1% American Indian and Alaska Native
--- 0.2% Asian
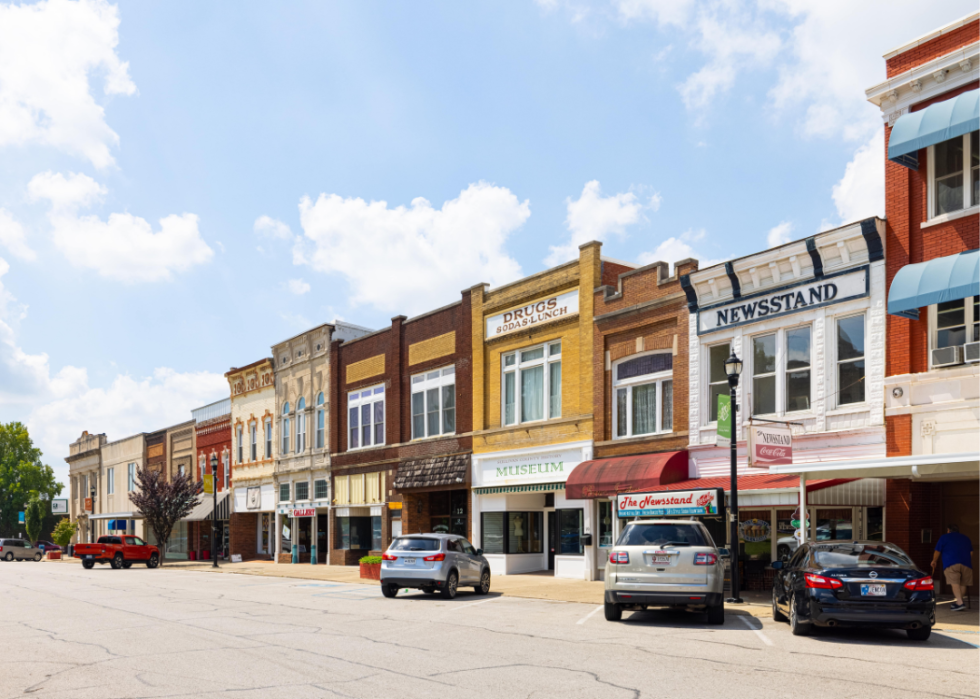
#47. Washington County
- Median Income: $53,932
- Population: 28,025
--- 97% white
--- 0.1% Black
--- 0% American Indian and Alaska Native
--- 0.2% Asian
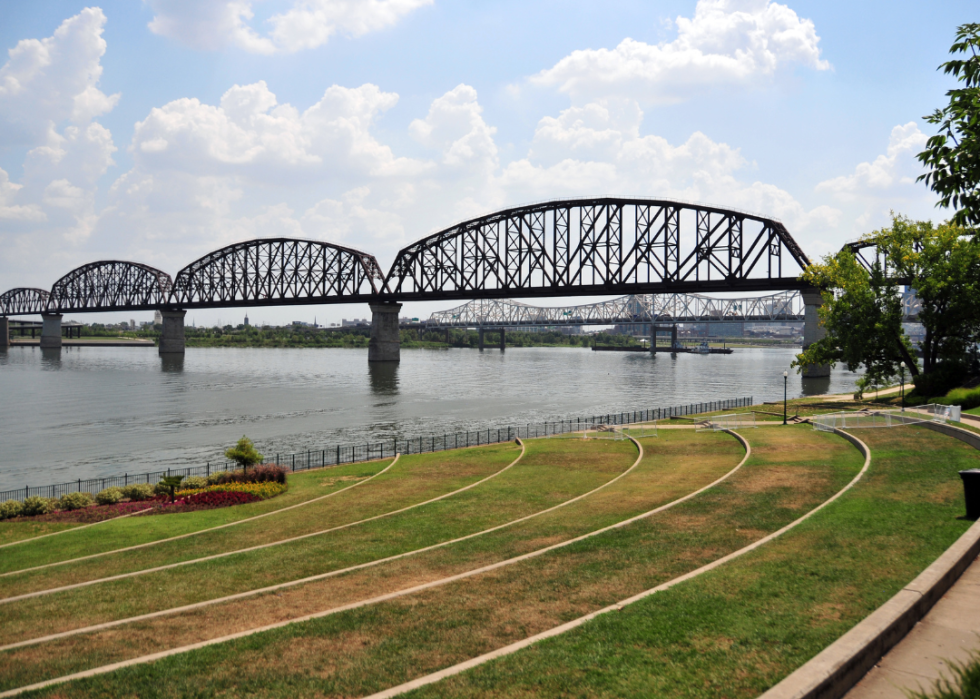
#46. Clark County
- Median Income: $62,296
- Population: 120,185
--- 85.9% white
--- 6.8% Black
--- 0.2% American Indian and Alaska Native
--- 0.9% Asian
#45. Sullivan County
- Median Income: $49,393
- Population: 20,814
--- 91.8% white
--- 3.5% Black
--- 0.1% American Indian and Alaska Native
--- 0.1% Asian
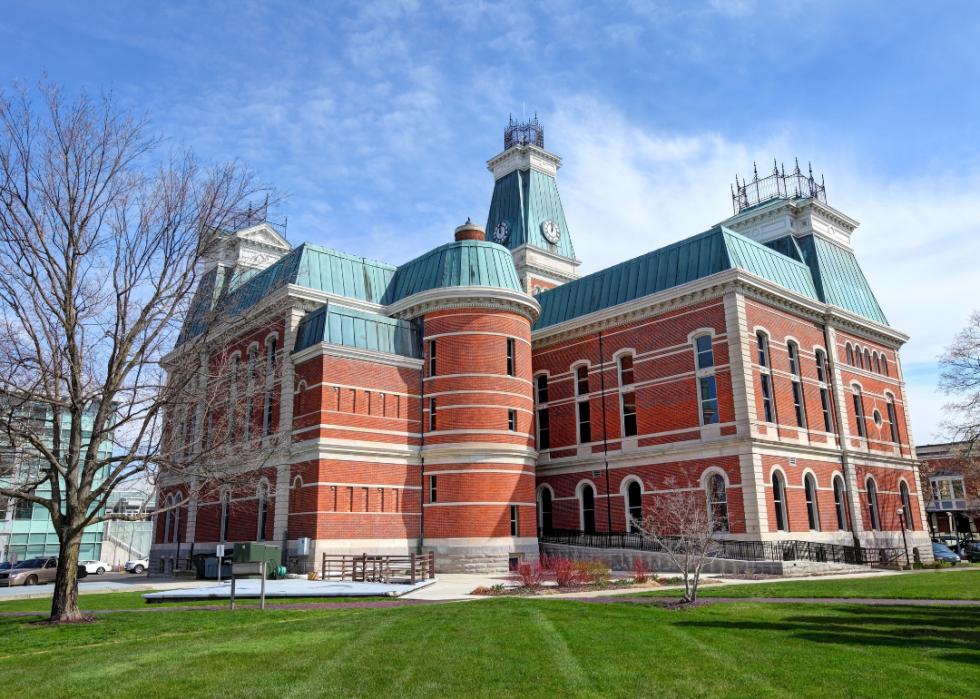
#44. Bartholomew County
- Median Income: $71,183
- Population: 81,759
--- 83.3% white
--- 1.9% Black
--- 0.1% American Indian and Alaska Native
--- 8% Asian

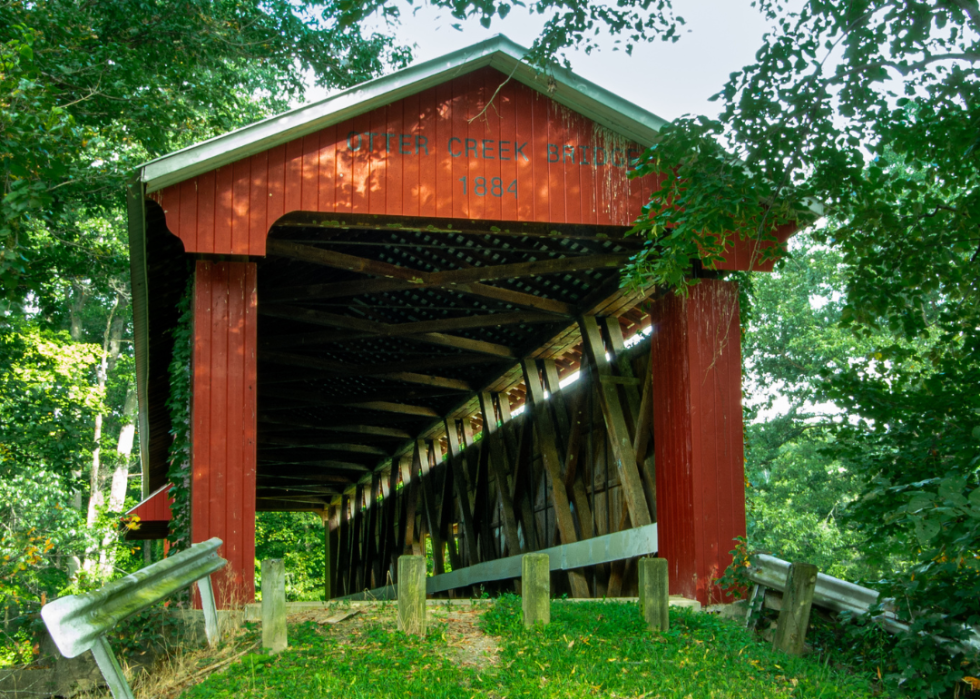
#43. Parke County
- Median Income: $57,156
- Population: 16,316
--- 94.5% white
--- 1.1% Black
--- 0.1% American Indian and Alaska Native
--- 0% Asian

#42. Montgomery County
- Median Income: $58,311
- Population: 37,967
--- 93.5% white
--- 1% Black
--- 0% American Indian and Alaska Native
--- 0.5% Asian
#41. Kosciusko County
- Median Income: $66,764
- Population: 80,151
--- 90.8% white
--- 0.7% Black
--- 0.2% American Indian and Alaska Native
--- 1.5% Asian
#40. Pulaski County
- Median Income: $52,098
- Population: 12,496
--- 93.6% white
--- 0.1% Black
--- 0.1% American Indian and Alaska Native
--- 0.5% Asian
#39. Wells County
- Median Income: $62,802
- Population: 28,103
--- 94.6% white
--- 0.8% Black
--- 0% American Indian and Alaska Native
--- 0.4% Asian
#38. Brown County
- Median Income: $67,737
- Population: 15,444
--- 96.1% white
--- 0.6% Black
--- 0% American Indian and Alaska Native
--- 0.6% Asian

#37. Warren County
- Median Income: $68,136
- Population: 8,430
--- 97% white
--- 0.3% Black
--- 0% American Indian and Alaska Native
--- 0.3% Asian

#36. Fountain County
- Median Income: $54,475
- Population: 16,422
--- 96.7% white
--- 0.5% Black
--- 0.2% American Indian and Alaska Native
--- 0.5% Asian

#35. Pike County
- Median Income: $57,283
- Population: 12,220
--- 96% white
--- 0.7% Black
--- 0% American Indian and Alaska Native
--- 0.3% Asian
#34. Rush County
- Median Income: $58,887
- Population: 16,706
--- 97.1% white
--- 0.6% Black
--- 0% American Indian and Alaska Native
--- 0.1% Asian
#33. Benton County
- Median Income: $56,155
- Population: 8,687
--- 95.3% white
--- 0.7% Black
--- 0% American Indian and Alaska Native
--- 0.1% Asian
#32. DeKalb County
- Median Income: $60,757
- Population: 43,059
--- 96.1% white
--- 0.2% Black
--- 0.1% American Indian and Alaska Native
--- 0.6% Asian
#31. Decatur County
- Median Income: $65,000
- Population: 26,466
--- 95.4% white
--- 0.2% Black
--- 0% American Indian and Alaska Native
--- 1.3% Asian
#30. Gibson County
- Median Income: $59,697
- Population: 33,017
--- 92.9% white
--- 2.4% Black
--- 0% American Indian and Alaska Native
--- 0.5% Asian
#29. Morgan County
- Median Income: $71,882
- Population: 71,394
--- 95.9% white
--- 0.3% Black
--- 0% American Indian and Alaska Native
--- 0.7% Asian

#28. Adams County
- Median Income: $56,037
- Population: 35,685
--- 95.2% white
--- 0.9% Black
--- 0.1% American Indian and Alaska Native
--- 0.1% Asian
#27. Posey County
- Median Income: $69,323
- Population: 25,301
--- 95.2% white
--- 1.5% Black
--- 0.1% American Indian and Alaska Native
--- 0.3% Asian
#26. Jasper County
- Median Income: $69,632
- Population: 33,006
--- 91.3% white
--- 1.1% Black
--- 0% American Indian and Alaska Native
--- 0.3% Asian

#25. Tippecanoe County
- Median Income: $53,468
- Population: 185,961
--- 79.3% white
--- 5.8% Black
--- 0.1% American Indian and Alaska Native
--- 7.9% Asian
#24. Perry County
- Median Income: $54,387
- Population: 19,151
--- 94.1% white
--- 2.9% Black
--- 0.1% American Indian and Alaska Native
--- 0.7% Asian
#23. Dubois County
- Median Income: $65,389
- Population: 43,474
--- 91.5% white
--- 1.2% Black
--- 0.3% American Indian and Alaska Native
--- 0.4% Asian

#22. Carroll County
- Median Income: $56,929
- Population: 20,288
--- 95.3% white
--- 0.6% Black
--- 0% American Indian and Alaska Native
--- 0.2% Asian
#21. Switzerland County
- Median Income: $56,268
- Population: 9,870
--- 95.8% white
--- 0.3% Black
--- 0.2% American Indian and Alaska Native
--- 0.7% Asian
#20. Floyd County
- Median Income: $69,858
- Population: 79,594
--- 88.8% white
--- 5% Black
--- 0.1% American Indian and Alaska Native
--- 1.2% Asian
#19. Franklin County
- Median Income: $69,440
- Population: 22,769
--- 96.7% white
--- 0% Black
--- 0% American Indian and Alaska Native
--- 0.6% Asian

#18. Ohio County
- Median Income: $63,036
- Population: 5,931
--- 96.1% white
--- 0.2% Black
--- 0.1% American Indian and Alaska Native
--- 0.7% Asian
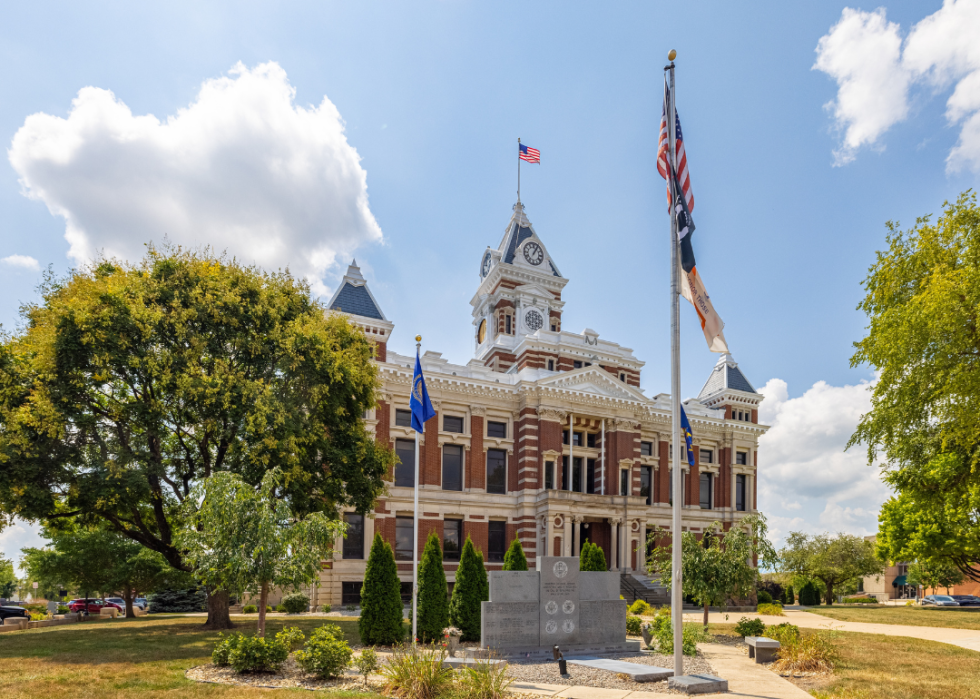
#17. Johnson County
- Median Income: $77,977
- Population: 159,739
--- 89.4% white
--- 2.7% Black
--- 0.1% American Indian and Alaska Native
--- 3.9% Asian

#16. Harrison County
- Median Income: $63,586
- Population: 39,516
--- 95.8% white
--- 0.6% Black
--- 0% American Indian and Alaska Native
--- 0.5% Asian
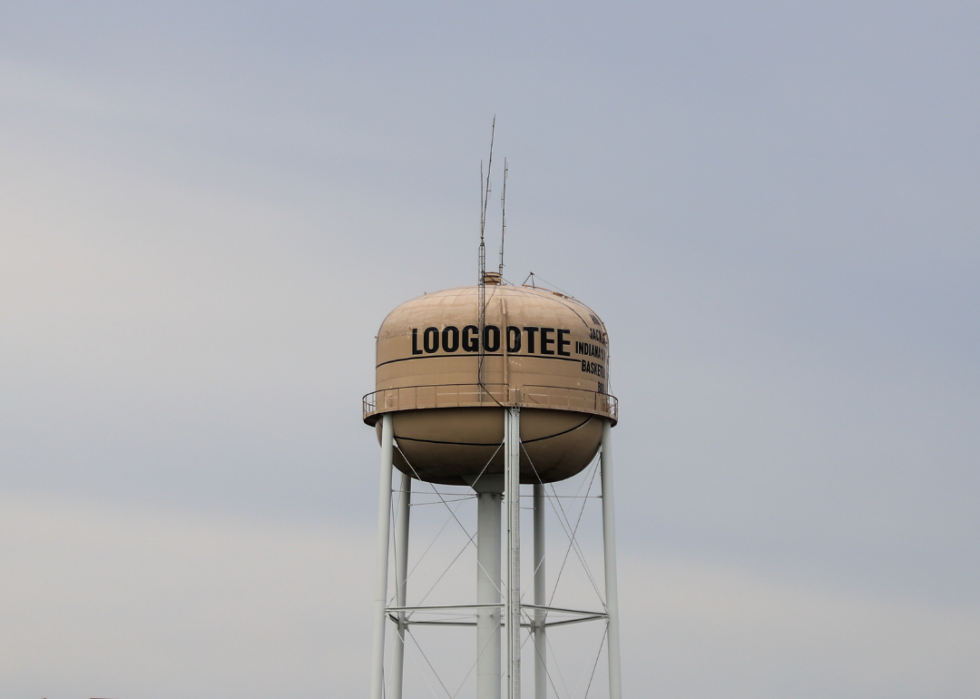
#15. Martin County
- Median Income: $57,199
- Population: 9,885
--- 96.9% white
--- 0.4% Black
--- 0.6% American Indian and Alaska Native
--- 0.1% Asian
#14. Union County
- Median Income: $60,750
- Population: 7,098
--- 96.4% white
--- 0.3% Black
--- 0% American Indian and Alaska Native
--- 1.8% Asian

#13. Putnam County
- Median Income: $64,993
- Population: 36,838
--- 92.6% white
--- 2.6% Black
--- 0.1% American Indian and Alaska Native
--- 2.6% Asian
#12. Porter County
- Median Income: $76,736
- Population: 172,353
--- 88.1% white
--- 4.1% Black
--- 0.1% American Indian and Alaska Native
--- 1.4% Asian
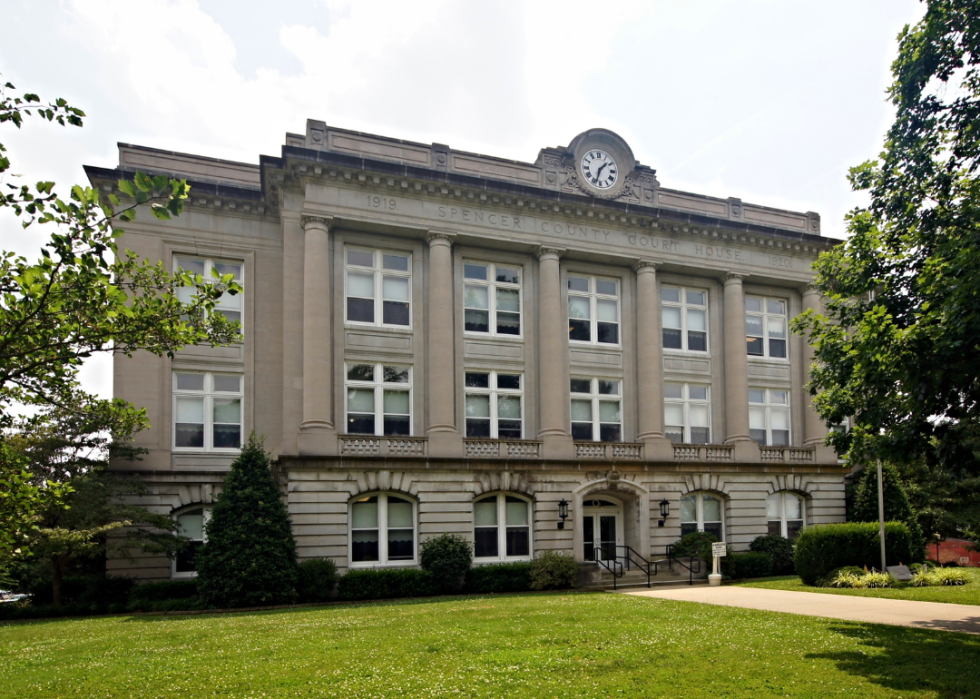
#11. Spencer County
- Median Income: $59,624
- Population: 19,949
--- 96% white
--- 0.7% Black
--- 0% American Indian and Alaska Native
--- 0.4% Asian
#10. Hendricks County
- Median Income: $87,961
- Population: 172,100
--- 84.4% white
--- 7.5% Black
--- 0.2% American Indian and Alaska Native
--- 3.1% Asian

#9. Tipton County
- Median Income: $65,983
- Population: 15,290
--- 96.6% white
--- 0.3% Black
--- 0.2% American Indian and Alaska Native
--- 0.7% Asian
#8. Whitley County
- Median Income: $67,716
- Population: 34,048
--- 95.3% white
--- 0.4% Black
--- 0.2% American Indian and Alaska Native
--- 0.4% Asian
#7. Dearborn County
- Median Income: $72,674
- Population: 50,494
--- 96.6% white
--- 0.5% Black
--- 0.1% American Indian and Alaska Native
--- 0.6% Asian
#6. Ripley County
- Median Income: $64,221
- Population: 28,953
--- 96.7% white
--- 0.3% Black
--- 0% American Indian and Alaska Native
--- 0.9% Asian
#5. Warrick County
- Median Income: $85,613
- Population: 63,575
--- 92.1% white
--- 2% Black
--- 0.1% American Indian and Alaska Native
--- 2.4% Asian
#4. Hancock County
- Median Income: $79,126
- Population: 78,616
--- 92.1% white
--- 2.7% Black
--- 0.1% American Indian and Alaska Native
--- 0.8% Asian
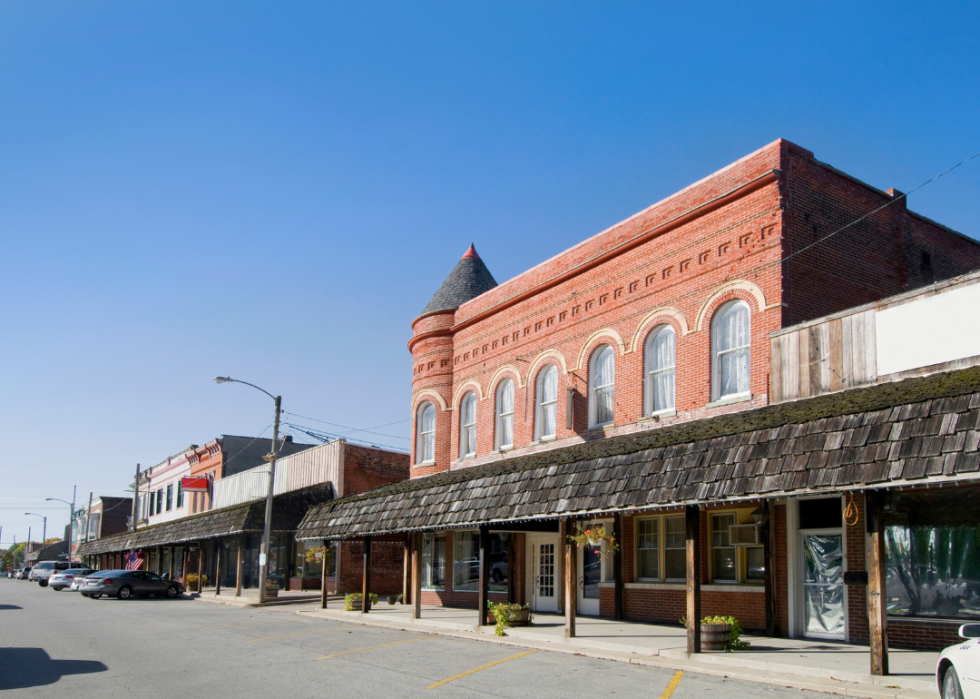
#3. Boone County
- Median Income: $94,843
- Population: 69,839
--- 90.6% white
--- 2.1% Black
--- 0.1% American Indian and Alaska Native
--- 3.2% Asian
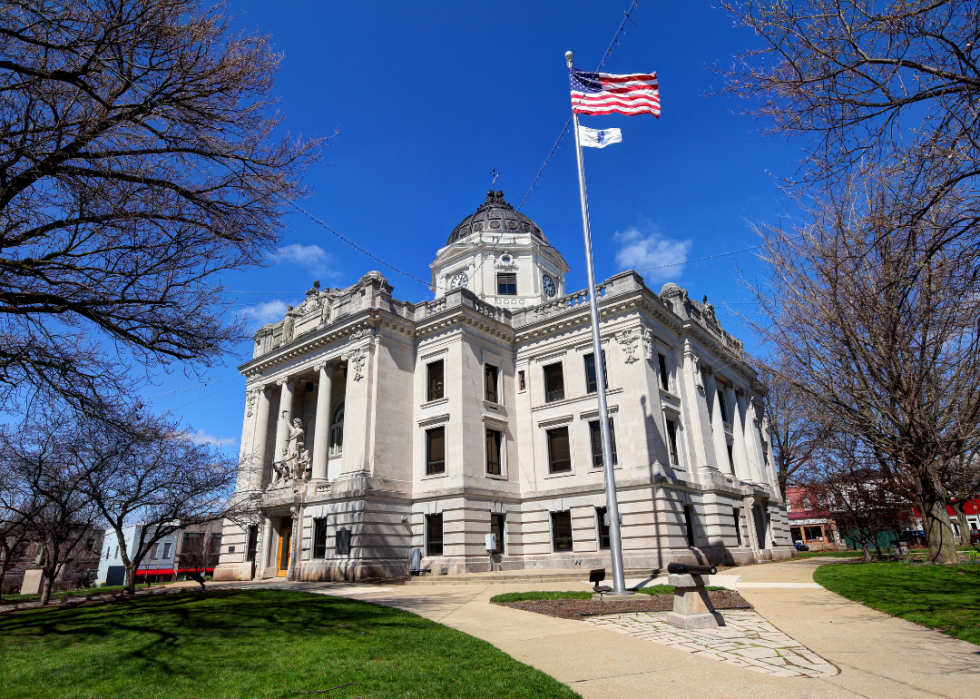
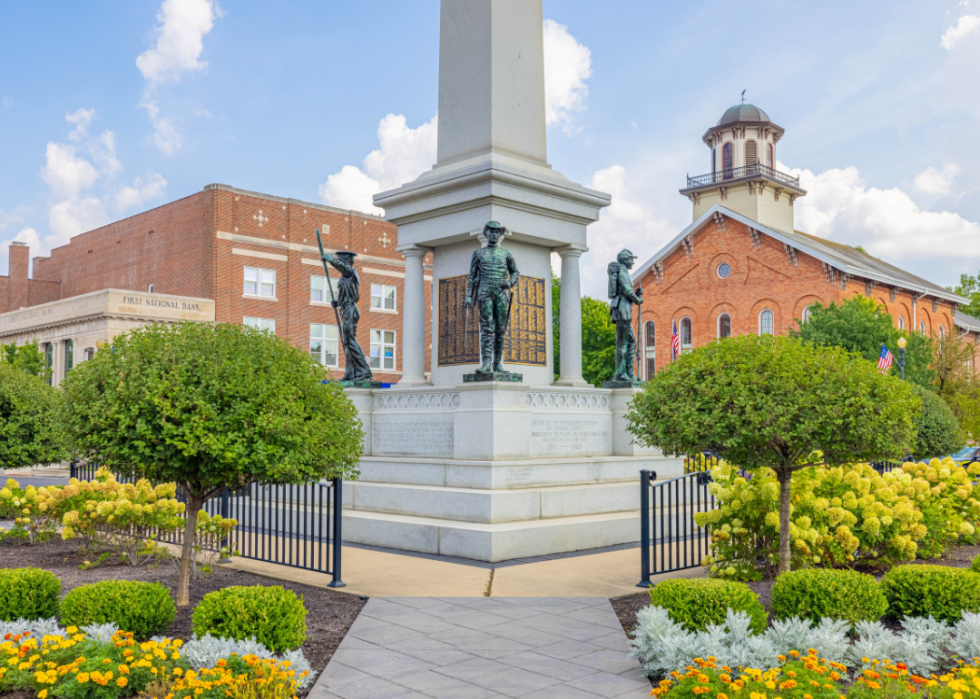
#2. Monroe County
- Median Income: $54,096
- Population: 140,189
--- 85% white
--- 3.4% Black
--- 0.1% American Indian and Alaska Native
--- 6.6% Asian

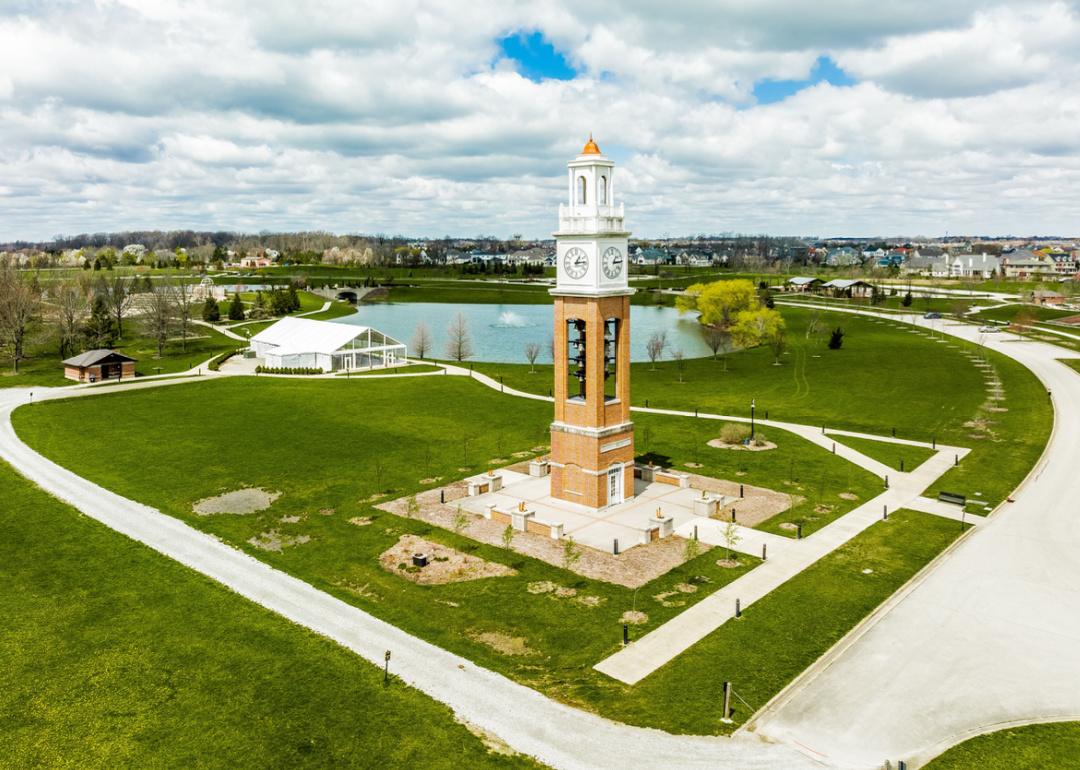
#1. Hamilton County
- Median Income: $104,858
- Population: 341,616
--- 84.8% white
--- 3.9% Black
--- 0.1% American Indian and Alaska Native
--- 6.3% Asian
This story features data reporting and writing by Dom DiFurio and is part of a series utilizing data automation across 50 states.