Counties with the most homes selling under list price in Florida
Counties with the most homes selling under list price in Florida
It's a tough time to be in the market for a new house. But as peak homebuying season begins, homebuyers are starting to have at least some negotiating power—especially in markets that recorded large price growth over the last few years.
The average 30-year, fixed-rate mortgage rose above 7% at the start of November 2022, the highest level in more than a decade, as the Federal Reserve raised its benchmark rates to combat inflation. Today, rates remain at historic highs; even half of a percentage point change can significantly affect the monthly payments required for a mortgage.
Since mortgage rates were under 4% for the better part of the past decade, many homebuyers locked in far more affordable rates than what's available in today's environment. And sellers aren't exactly coming down on price: Nationally, home prices are still increasing—just more slowly than they did during the height of the COVID-19 pandemic.
Nationally, the median home sale price in March was $420,321, 4.8% higher than the year before. In Florida, the median sale price was $415,300, while the average price difference was 3.09% below asking.
Stacker compiled a list of counties in Florida where homes typically sell below list price using data from Redfin.

#39. Leon County
- Average price difference: 1.70% below list
-- Median list price: $289,700
-- Median sale price: $294,900
- Total homes sold: 297
-- Share that sold above list: 21.5%
#38. Santa Rosa County
- Average price difference: 1.86% below list
-- Median list price: $373,577
-- Median sale price: $360,000
- Total homes sold: 325
-- Share that sold above list: 13.2%

#37. Hillsborough County
- Average price difference: 2.04% below list
-- Median list price: $423,751
-- Median sale price: $389,645
- Total homes sold: 1,780
-- Share that sold above list: 15.6%
#36. Nassau County
- Average price difference: 2.09% below list
-- Median list price: $525,000
-- Median sale price: $492,500
- Total homes sold: 229
-- Share that sold above list: 11.4%
#35. Clay County
- Average price difference: 2.11% below list
-- Median list price: $363,900
-- Median sale price: $337,990
- Total homes sold: 305
-- Share that sold above list: 15.4%

#34. Pasco County
- Average price difference: 2.17% below list
-- Median list price: $359,000
-- Median sale price: $342,990
- Total homes sold: 1,255
-- Share that sold above list: 12.0%

#33. Polk County
- Average price difference: 2.17% below list
-- Median list price: $330,000
-- Median sale price: $320,000
- Total homes sold: 1,369
-- Share that sold above list: 14.5%
#32. Seminole County
- Average price difference: 2.17% below list
-- Median list price: $415,000
-- Median sale price: $410,000
- Total homes sold: 501
-- Share that sold above list: 14.4%

#31. Hernando County
- Average price difference: 2.21% below list
-- Median list price: $343,990
-- Median sale price: $320,000
- Total homes sold: 366
-- Share that sold above list: 12.6%
#30. Osceola County
- Average price difference: 2.27% below list
-- Median list price: $418,795
-- Median sale price: $392,000
- Total homes sold: 873
-- Share that sold above list: 11.6%
#29. Lake County
- Average price difference: 2.31% below list
-- Median list price: $390,715
-- Median sale price: $385,000
- Total homes sold: 713
-- Share that sold above list: 10.7%
#28. Okaloosa County
- Average price difference: 2.33% below list
-- Median list price: $399,000
-- Median sale price: $339,950
- Total homes sold: 378
-- Share that sold above list: 13.2%

#27. St. Johns County
- Average price difference: 2.39% below list
-- Median list price: $549,990
-- Median sale price: $490,000
- Total homes sold: 738
-- Share that sold above list: 9.6%
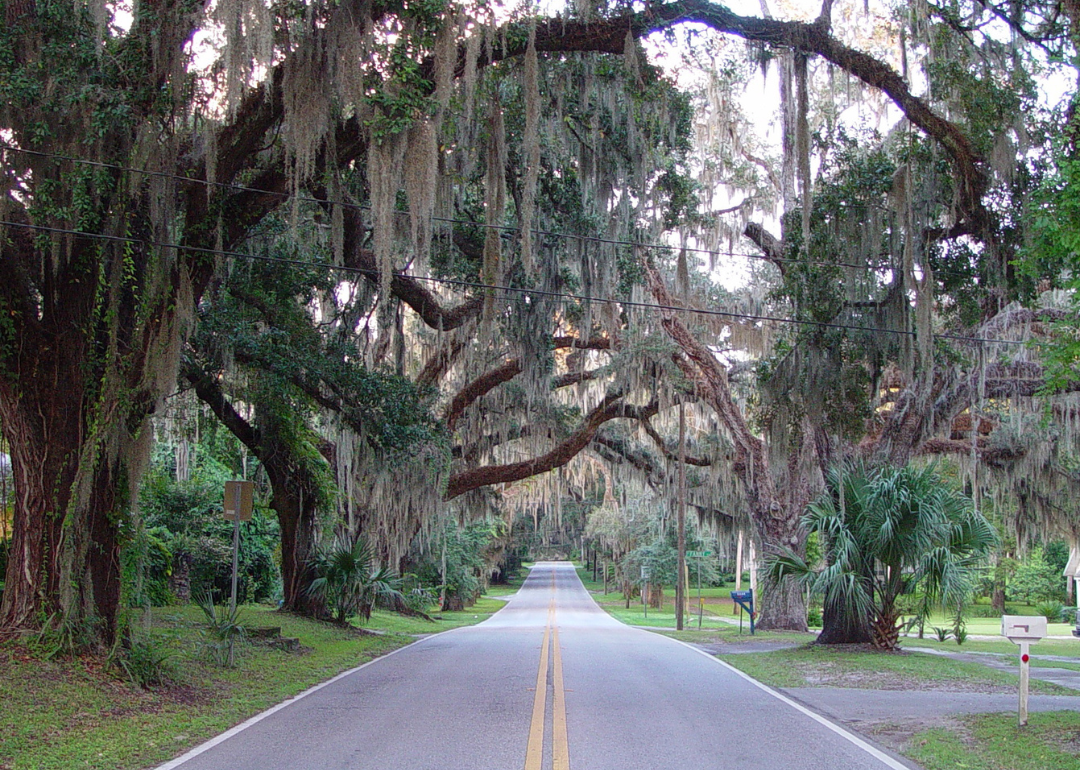
#26. Marion County
- Average price difference: 2.43% below list
-- Median list price: $289,000
-- Median sale price: $278,000
- Total homes sold: 895
-- Share that sold above list: 15.2%

#25. Orange County
- Average price difference: 2.48% below list
-- Median list price: $440,000
-- Median sale price: $424,990
- Total homes sold: 1,559
-- Share that sold above list: 14.9%

#24. Alachua County
- Average price difference: 2.50% below list
-- Median list price: $341,990
-- Median sale price: $320,000
- Total homes sold: 274
-- Share that sold above list: 14.2%

#23. Duval County
- Average price difference: 2.63% below list
-- Median list price: $332,995
-- Median sale price: $319,450
- Total homes sold: 1,294
-- Share that sold above list: 15.1%
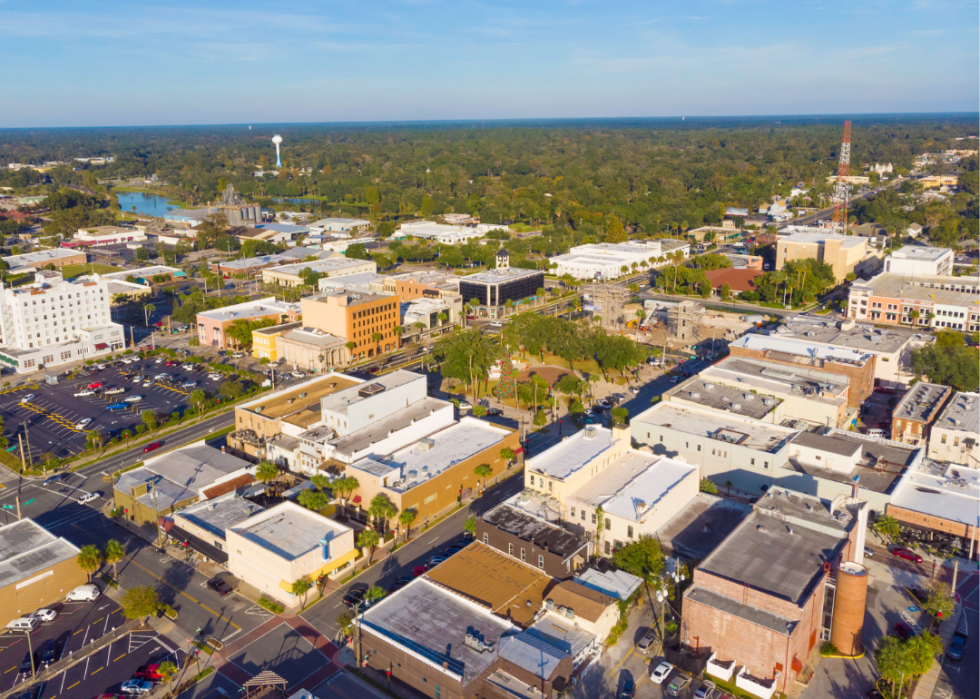
#22. Flagler County
- Average price difference: 2.68% below list
-- Median list price: $389,000
-- Median sale price: $361,500
- Total homes sold: 344
-- Share that sold above list: 7.6%

#21. Escambia County
- Average price difference: 2.76% below list
-- Median list price: $311,495
-- Median sale price: $296,400
- Total homes sold: 477
-- Share that sold above list: 12.8%
#20. St. Lucie County
- Average price difference: 2.79% below list
-- Median list price: $424,577
-- Median sale price: $380,000
- Total homes sold: 666
-- Share that sold above list: 12.2%
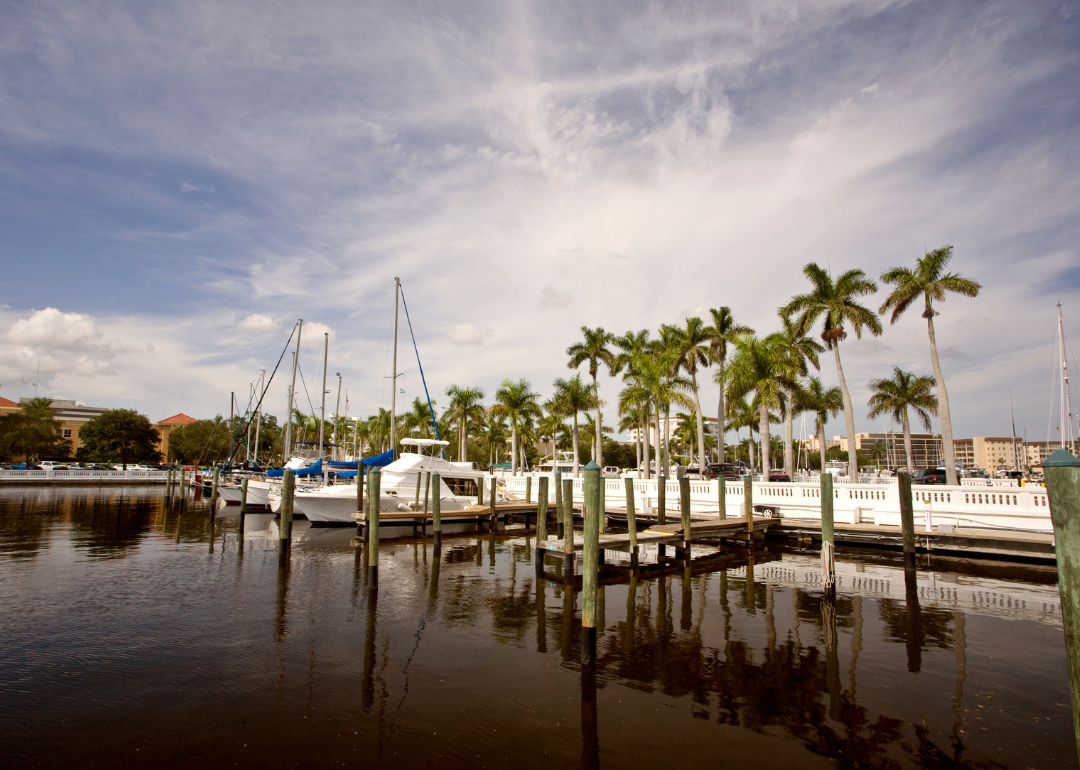
#19. Manatee County
- Average price difference: 2.80% below list
-- Median list price: $469,900
-- Median sale price: $435,000
- Total homes sold: 1,071
-- Share that sold above list: 7.2%
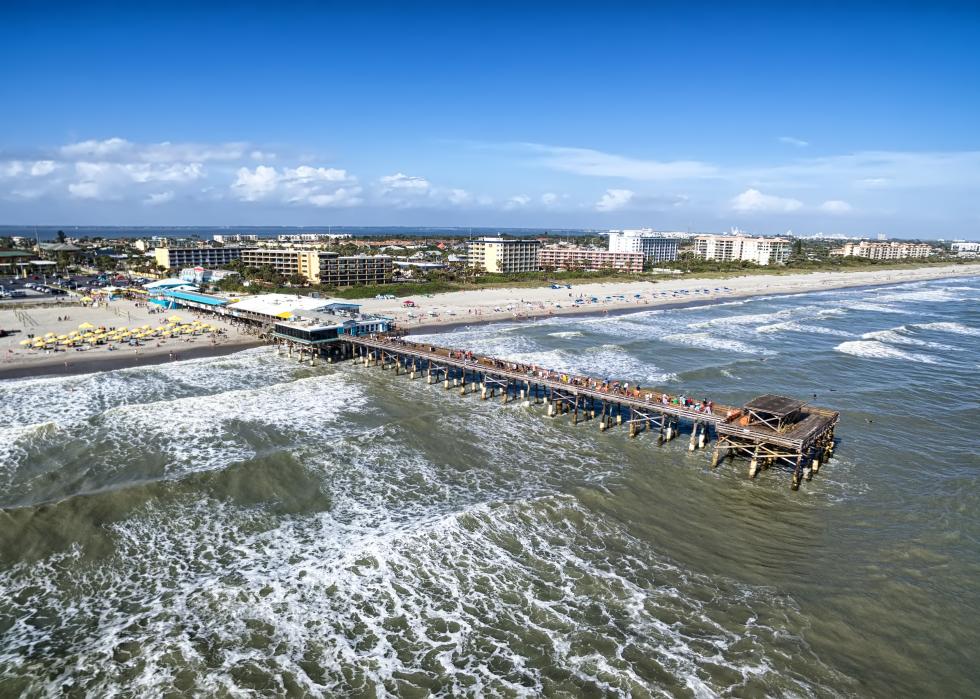
#18. Brevard County
- Average price difference: 2.89% below list
-- Median list price: $387,260
-- Median sale price: $361,750
- Total homes sold: 1,099
-- Share that sold above list: 9.7%
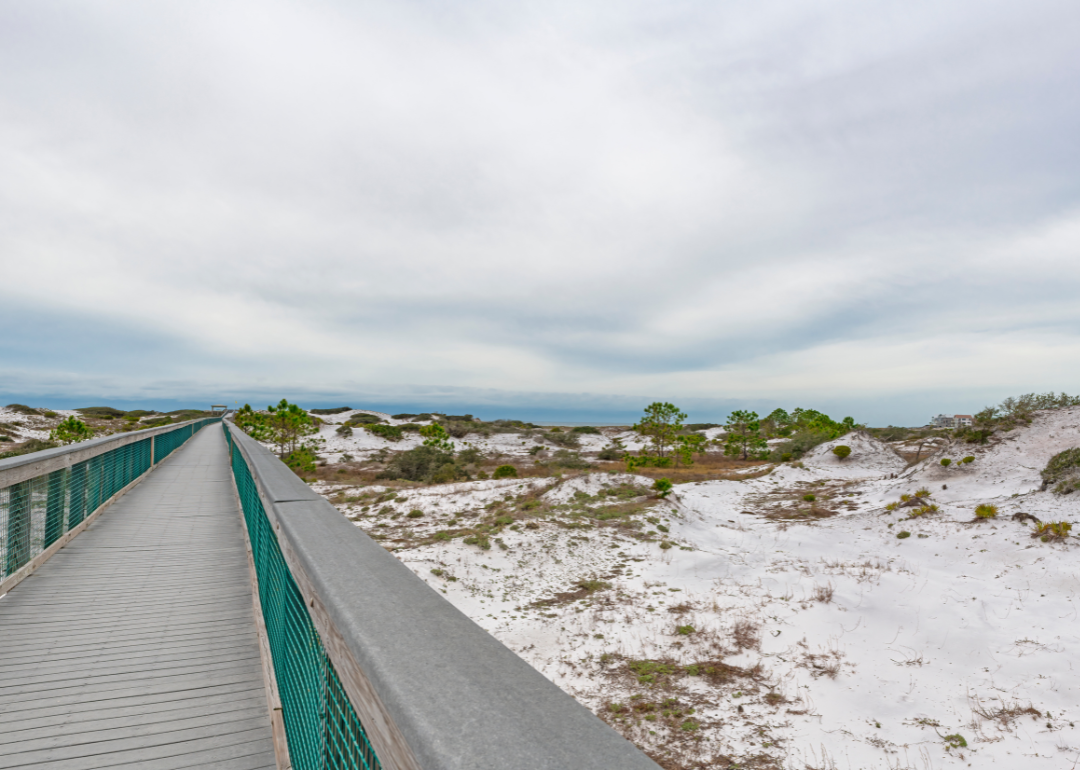
#17. Walton County
- Average price difference: 2.93% below list
-- Median list price: $875,000
-- Median sale price: $580,000
- Total homes sold: 315
-- Share that sold above list: 8.3%
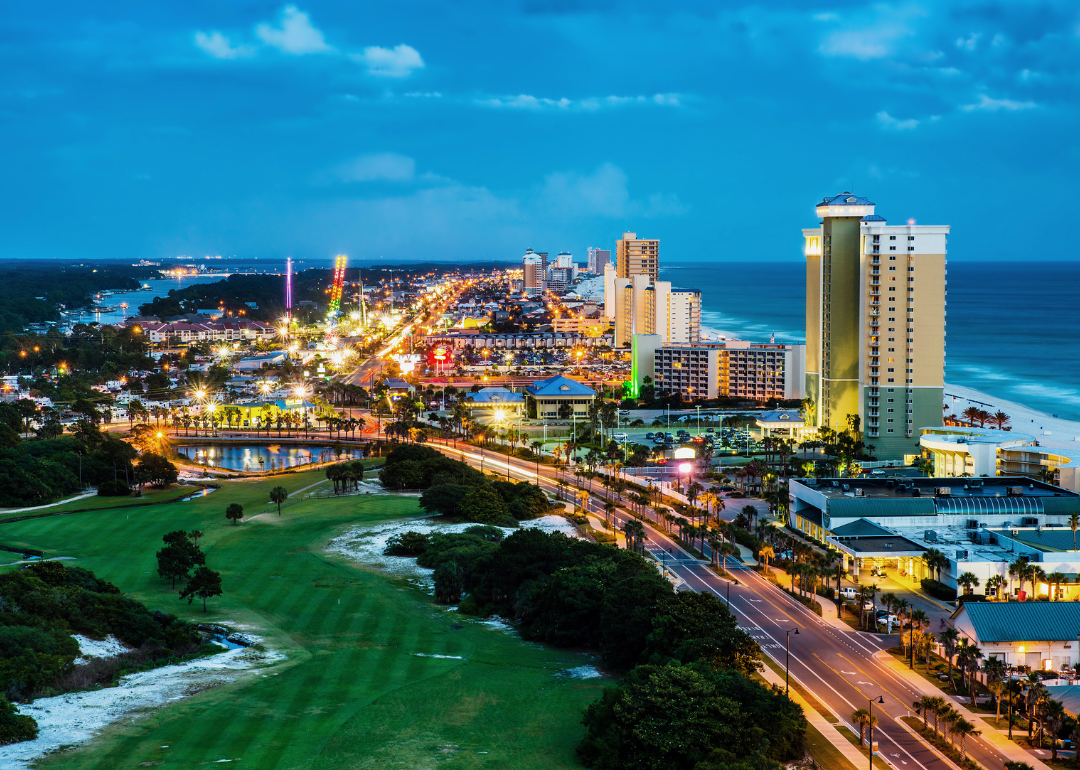
#16. Bay County
- Average price difference: 3.03% below list
-- Median list price: $430,000
-- Median sale price: $350,000
- Total homes sold: 400
-- Share that sold above list: 8.5%

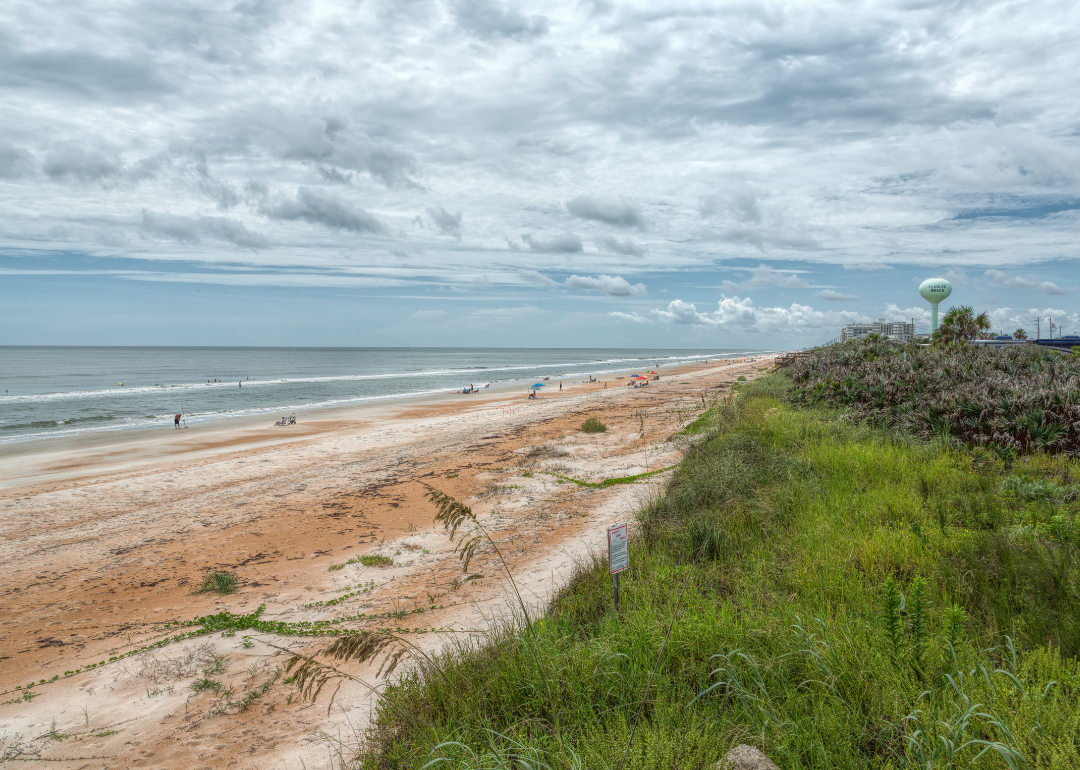
#15. Volusia County
- Average price difference: 3.03% below list
-- Median list price: $369,900
-- Median sale price: $355,000
- Total homes sold: 1,010
-- Share that sold above list: 10.8%
#14. Citrus County
- Average price difference: 3.25% below list
-- Median list price: $299,949
-- Median sale price: $290,000
- Total homes sold: 285
-- Share that sold above list: 14.4%
#13. Sumter County
- Average price difference: 3.33% below list
-- Median list price: $369,900
-- Median sale price: $350,400
- Total homes sold: 208
-- Share that sold above list: 7.7%
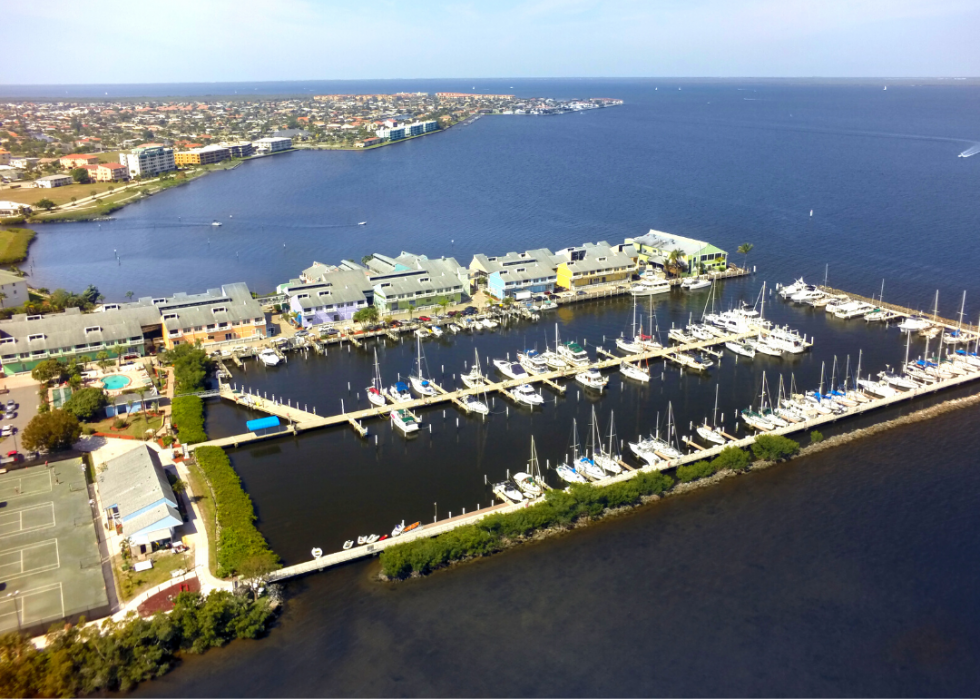
#12. Charlotte County
- Average price difference: 3.43% below list
-- Median list price: $370,000
-- Median sale price: $351,298
- Total homes sold: 655
-- Share that sold above list: 7.5%
#11. Pinellas County
- Average price difference: 3.45% below list
-- Median list price: $430,000
-- Median sale price: $399,900
- Total homes sold: 1,711
-- Share that sold above list: 11.3%
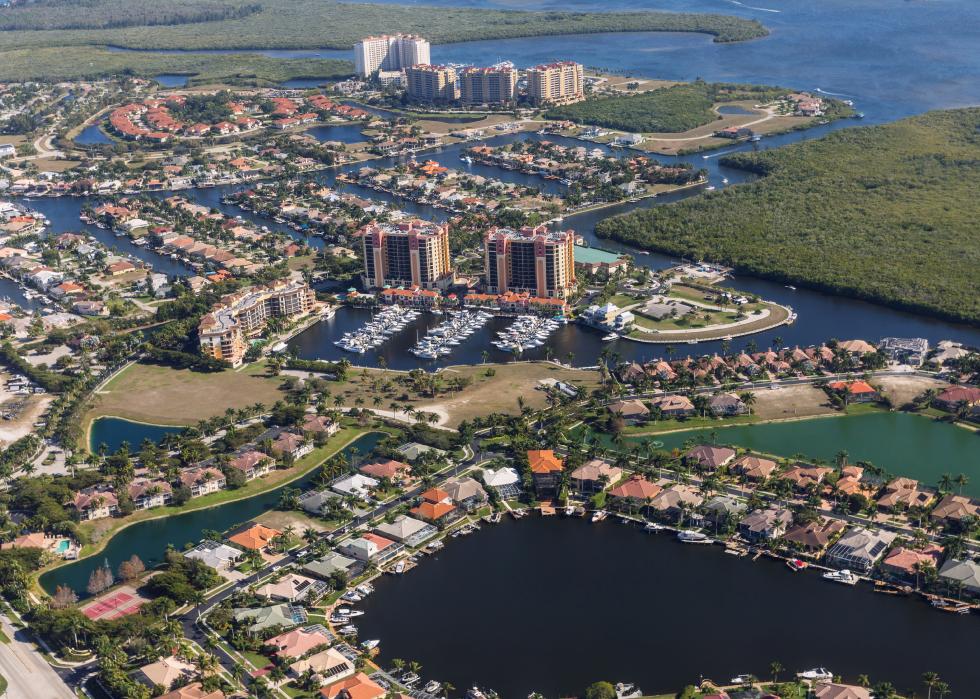
#10. Lee County
- Average price difference: 3.48% below list
-- Median list price: $429,900
-- Median sale price: $405,000
- Total homes sold: 1,987
-- Share that sold above list: 8.3%
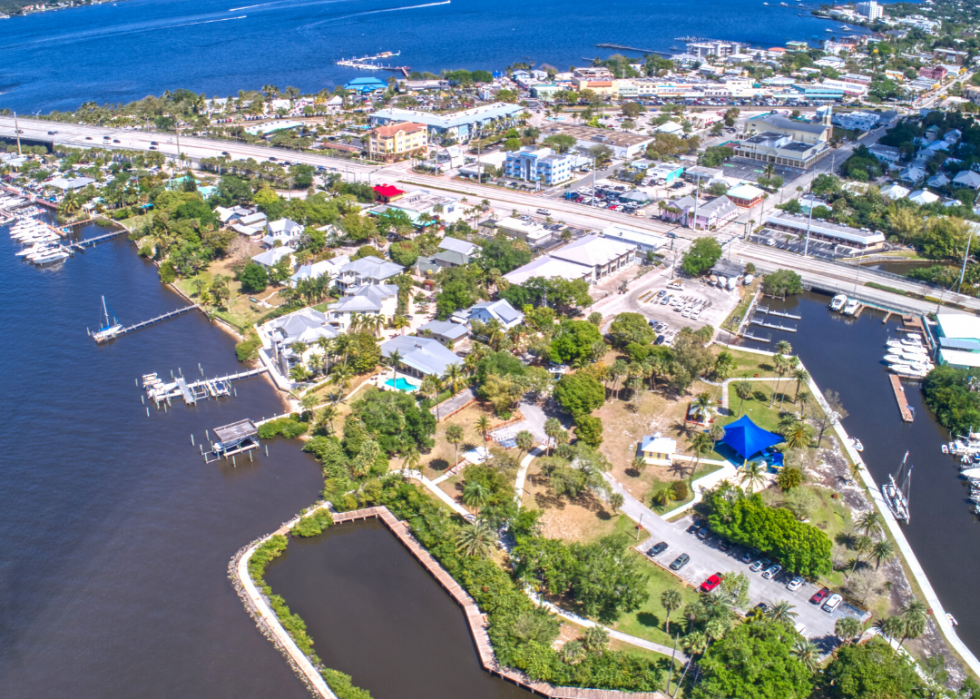
#9. Martin County
- Average price difference: 3.62% below list
-- Median list price: $513,200
-- Median sale price: $455,000
- Total homes sold: 307
-- Share that sold above list: 9.1%
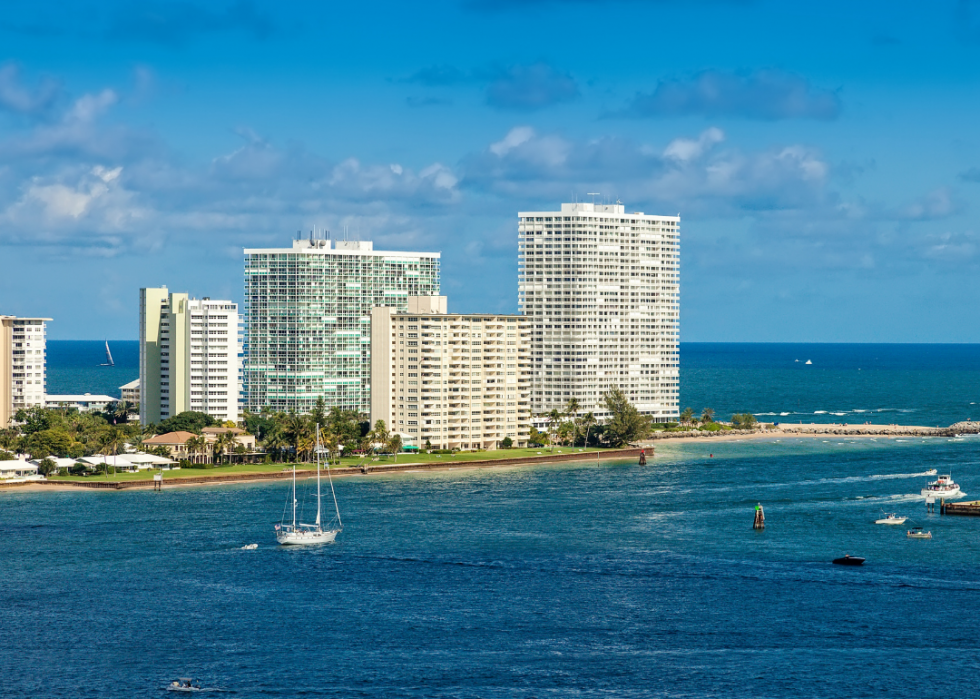
#8. Broward County
- Average price difference: 3.63% below list
-- Median list price: $440,000
-- Median sale price: $449,450
- Total homes sold: 2,397
-- Share that sold above list: 10.9%
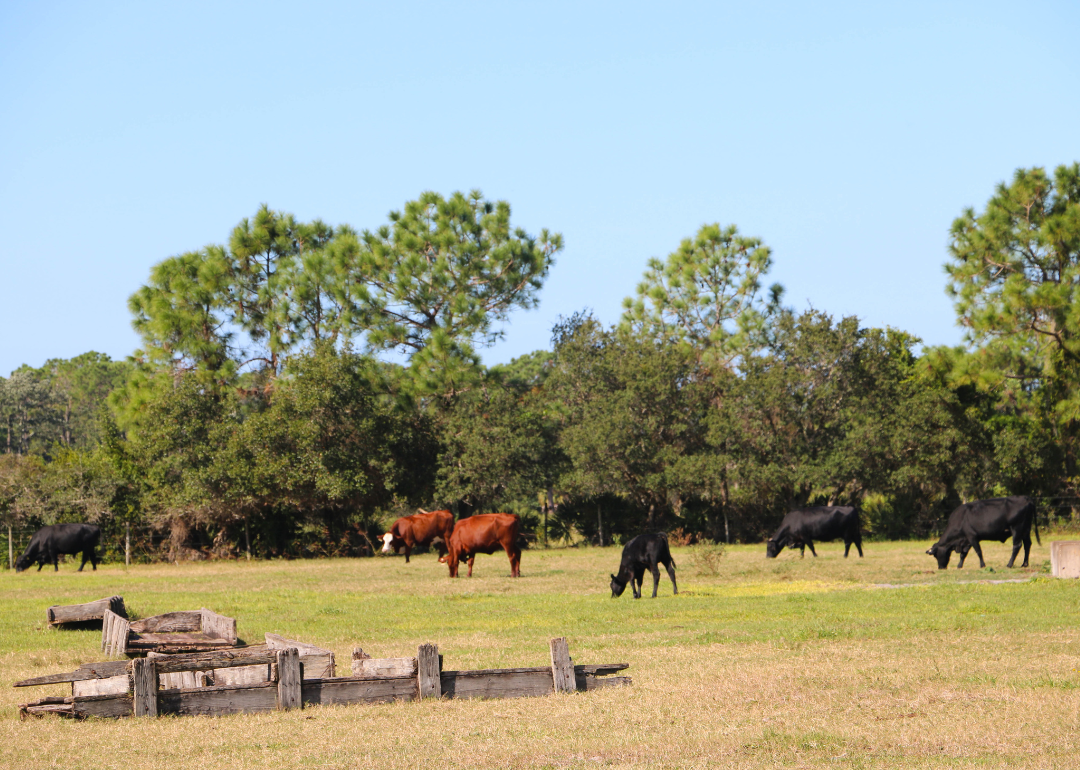
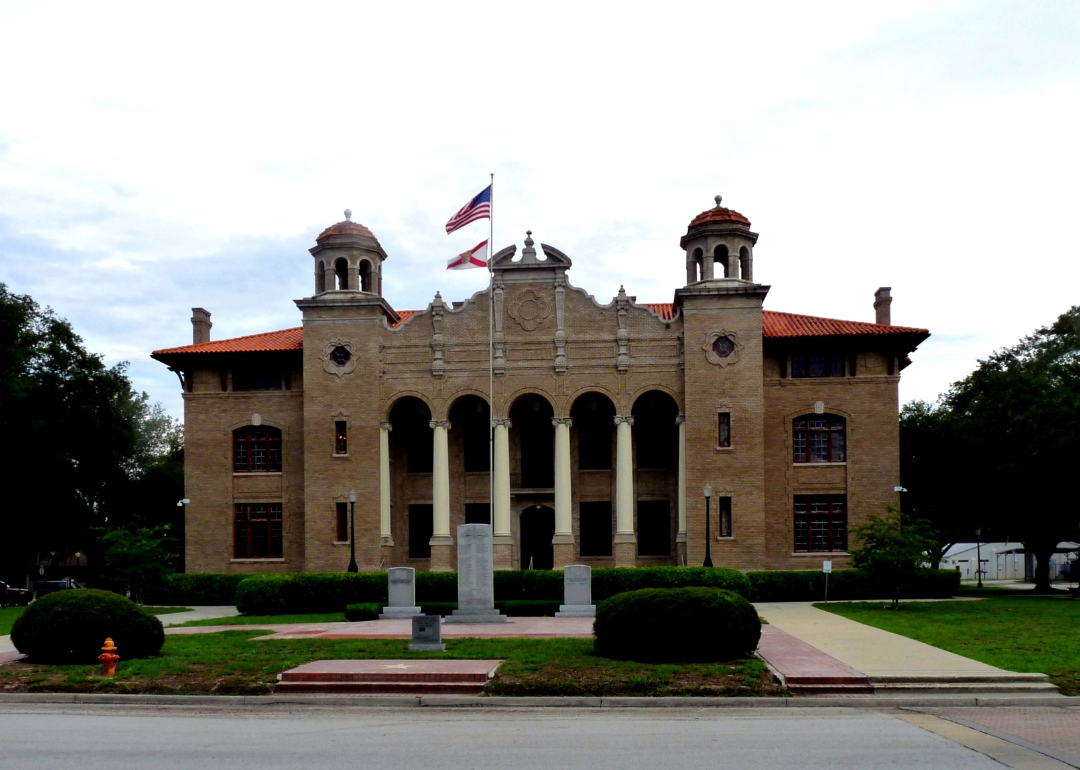
#7. Highlands County
- Average price difference: 3.69% below list
-- Median list price: $289,450
-- Median sale price: $270,000
- Total homes sold: 175
-- Share that sold above list: 9.7%
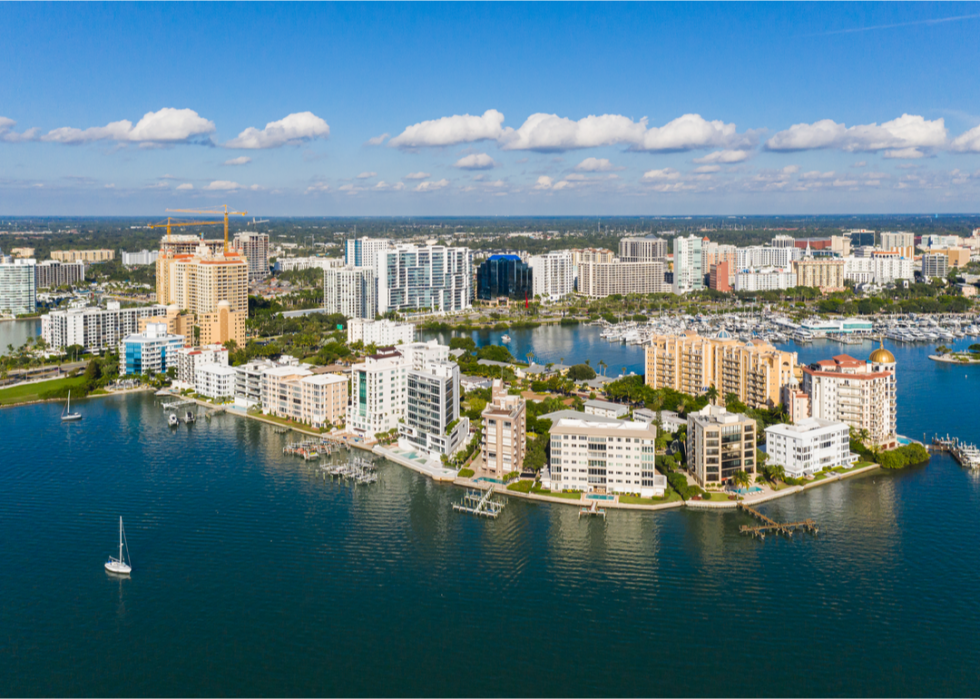
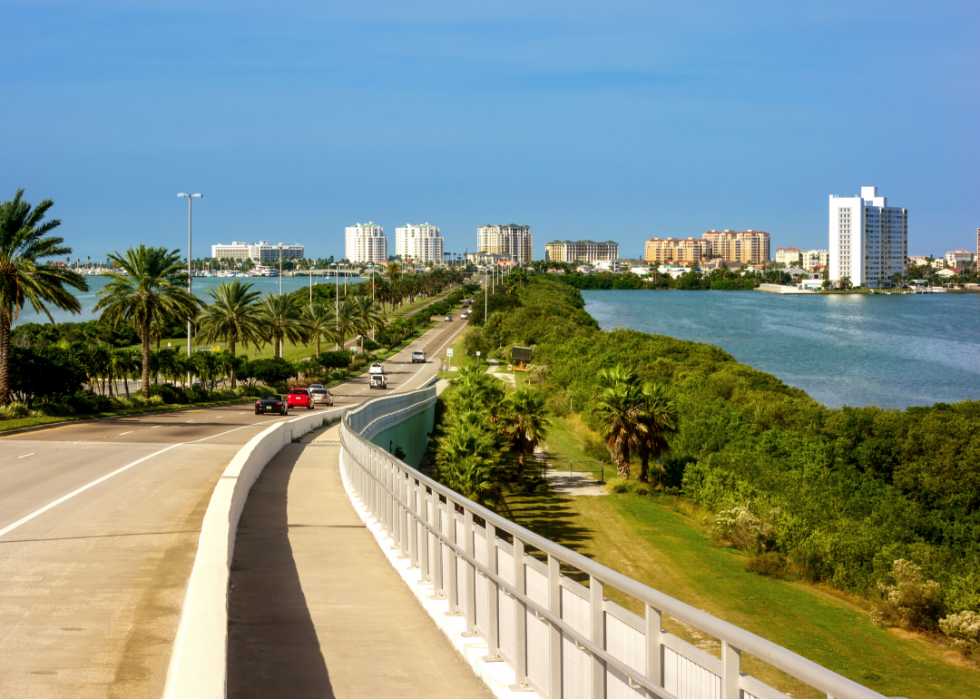
#6. Sarasota County
- Average price difference: 3.72% below list
-- Median list price: $475,000
-- Median sale price: $450,000
- Total homes sold: 1,207
-- Share that sold above list: 6.4%
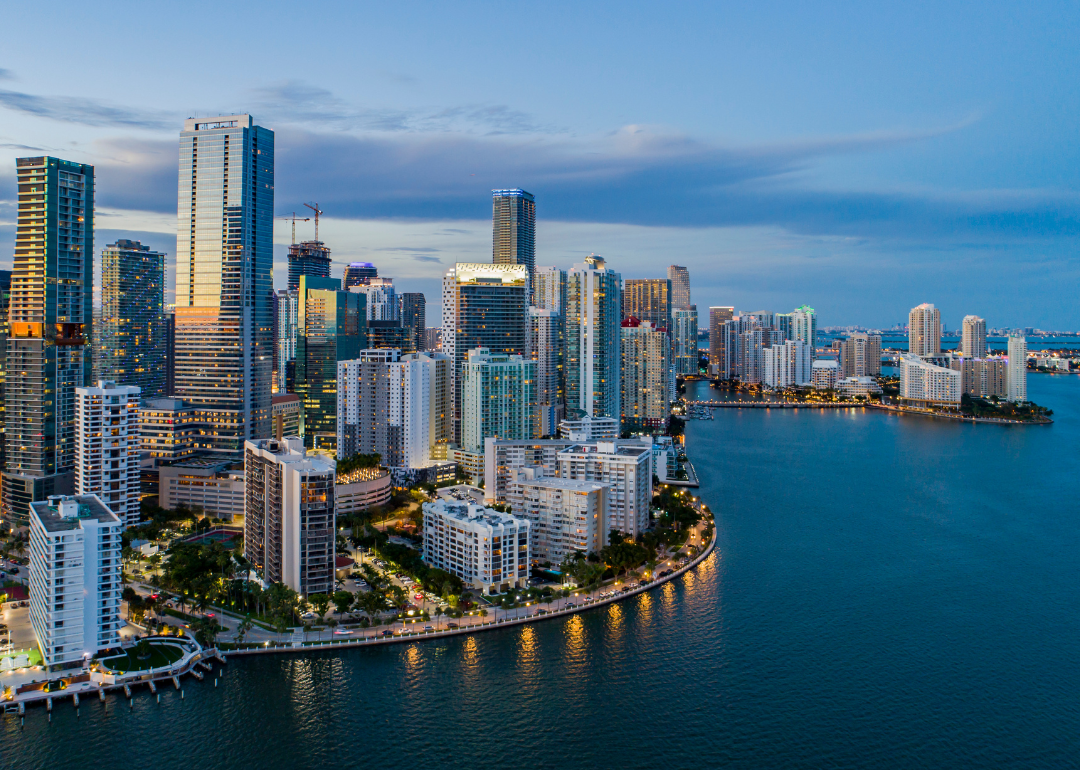
#5. Miami-Dade County
- Average price difference: 3.93% below list
-- Median list price: $575,000
-- Median sale price: $560,000
- Total homes sold: 2,320
-- Share that sold above list: 12.2%
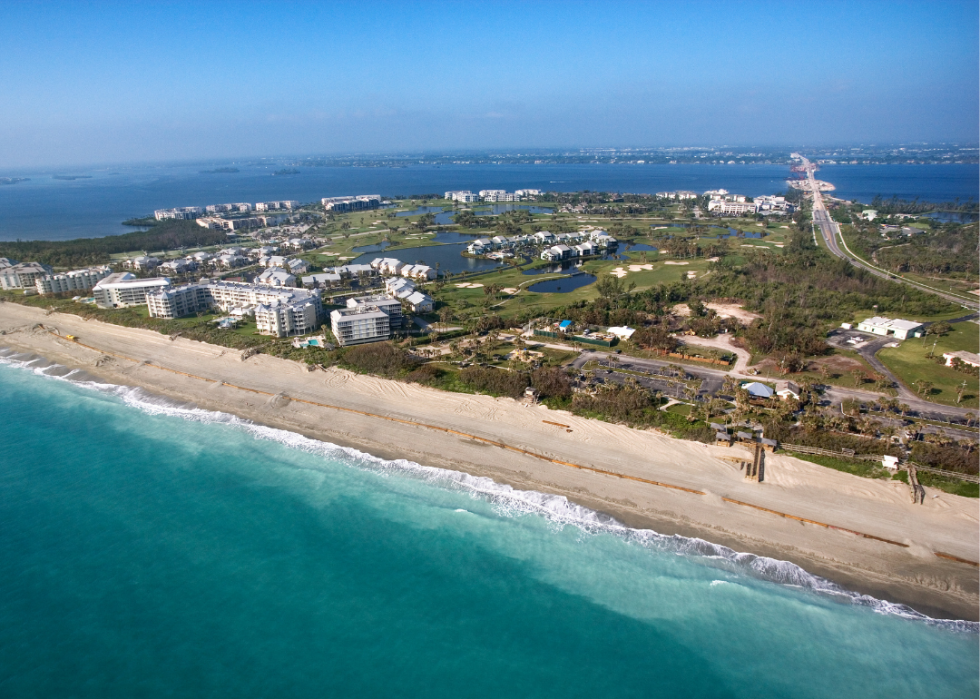
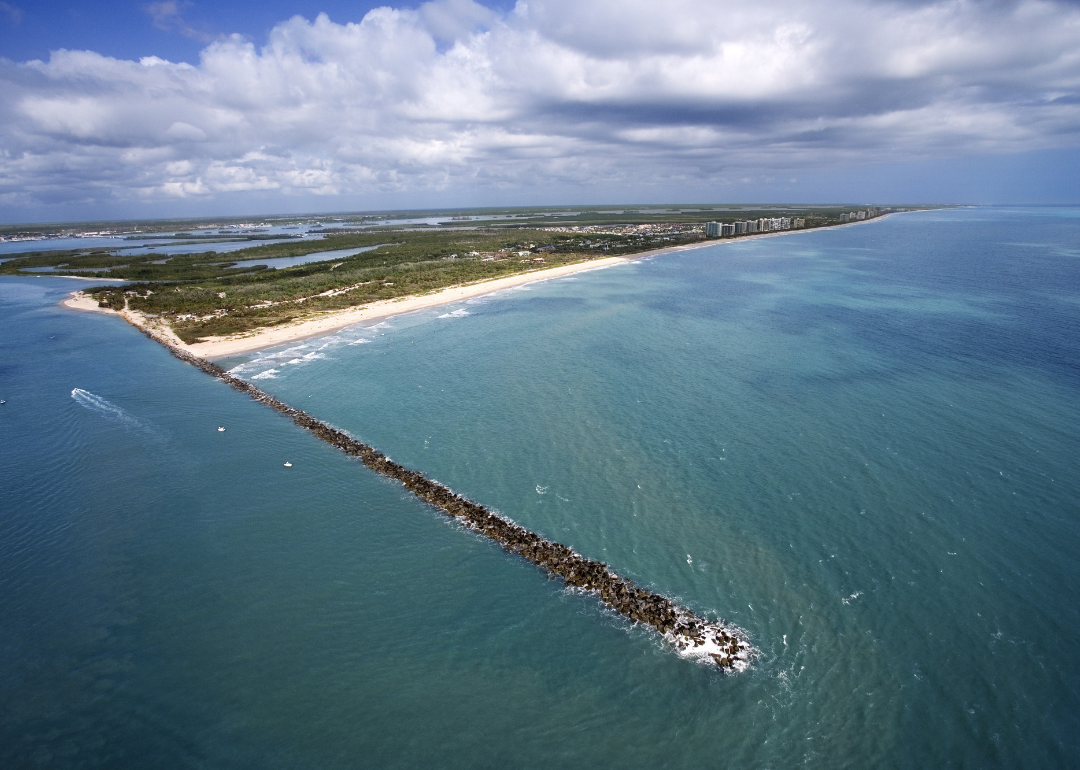
#4. Indian River County
- Average price difference: 4.04% below list
-- Median list price: $409,900
-- Median sale price: $420,000
- Total homes sold: 329
-- Share that sold above list: 7.6%

#3. Palm Beach County
- Average price difference: 4.39% below list
-- Median list price: $500,000
-- Median sale price: $515,000
- Total homes sold: 2,290
-- Share that sold above list: 7.9%
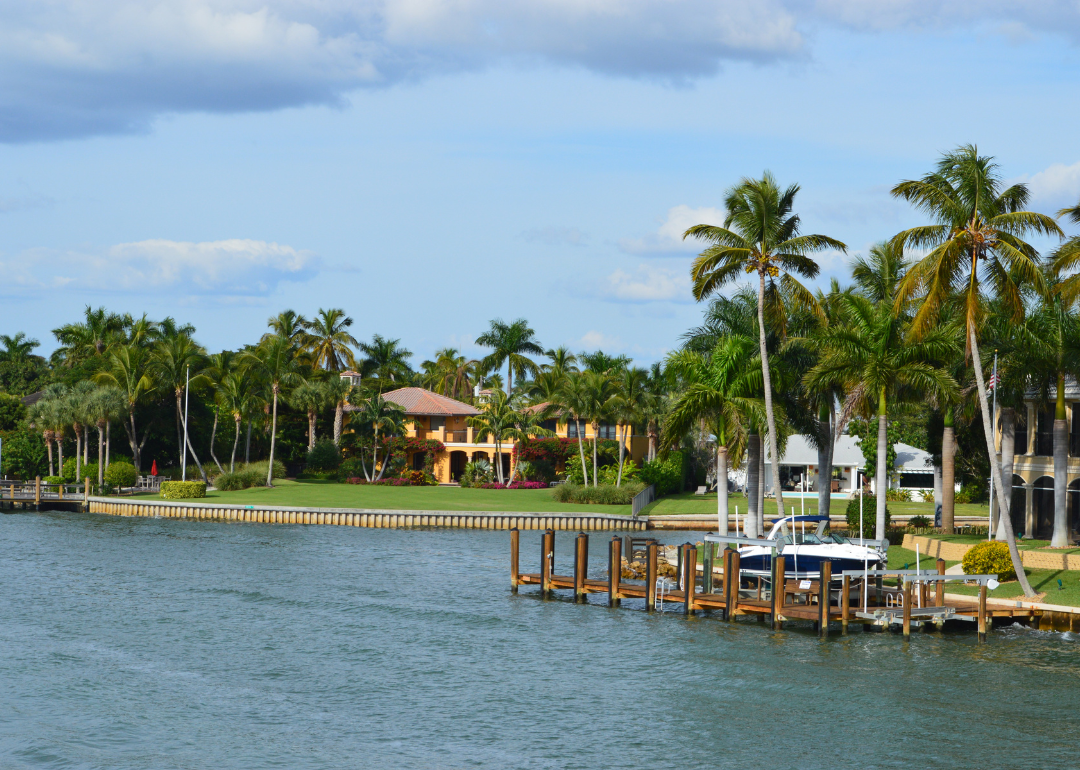
#2. Collier County
- Average price difference: 4.51% below list
-- Median list price: $742,500
-- Median sale price: $680,000
- Total homes sold: 987
-- Share that sold above list: 5.9%
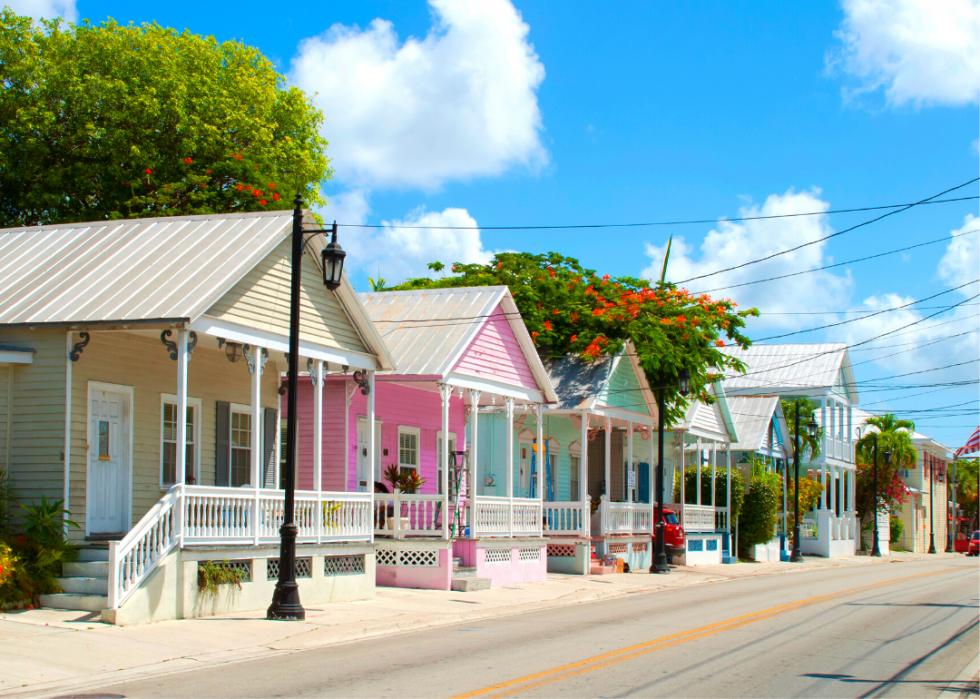
#1. Monroe County
- Average price difference: 5.63% below list
-- Median list price: $1,150,000
-- Median sale price: $1,010,000
- Total homes sold: 166
-- Share that sold above list: 4.2%
This story features data reporting and writing by Elena Cox and is part of a series utilizing data automation across 28 states.