Cities with the fastest-growing home prices in the Redding metro area
Cities with the fastest-growing home prices in the Redding metro area
The real estate frenzy spurred by the coronavirus pandemic continues, though at a slower pace. Buyers are still competing for a limited supply of housing, driving up prices for affordable properties.
The typical home value in the United States was $349,216 in February, 4.2% higher than the year before.
Increasing mortgage rates have slowed growth, with prices even declining in some places. But some areas are still seeing price jumps compared to the year before.
Stacker compiled a list of cities with the fastest-growing home prices in the Redding, CA metro area using data from Zillow. Cities are ranked by their one-year price change as of February 2024.
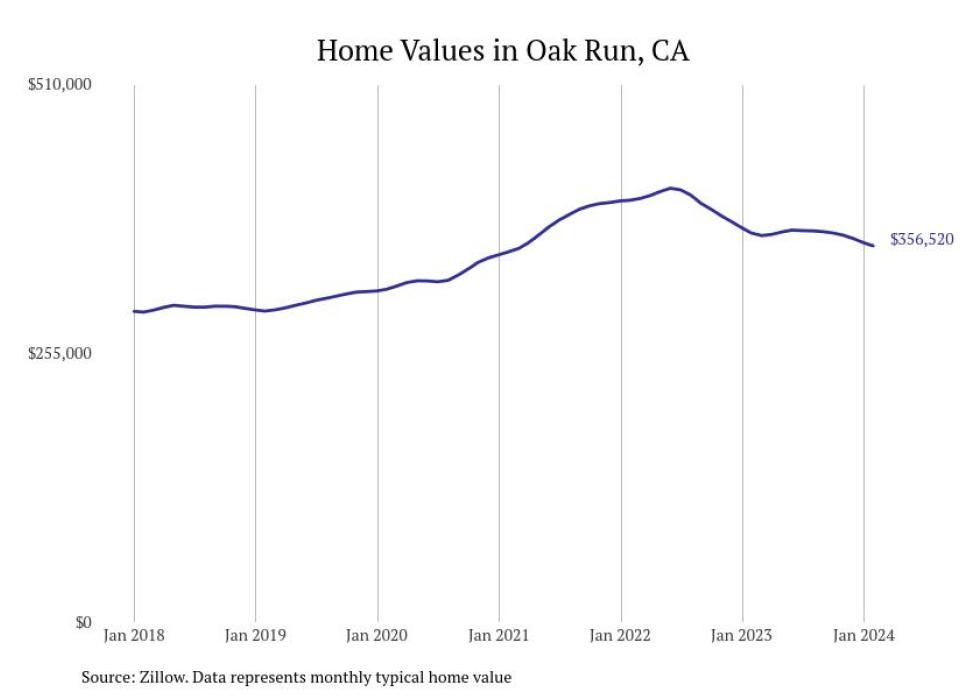
#17. Oak Run, CA
- 5-year price change: +$61,782 (+21.0%)
- Typical home value: $356,520 (#6 most expensive city in metro)
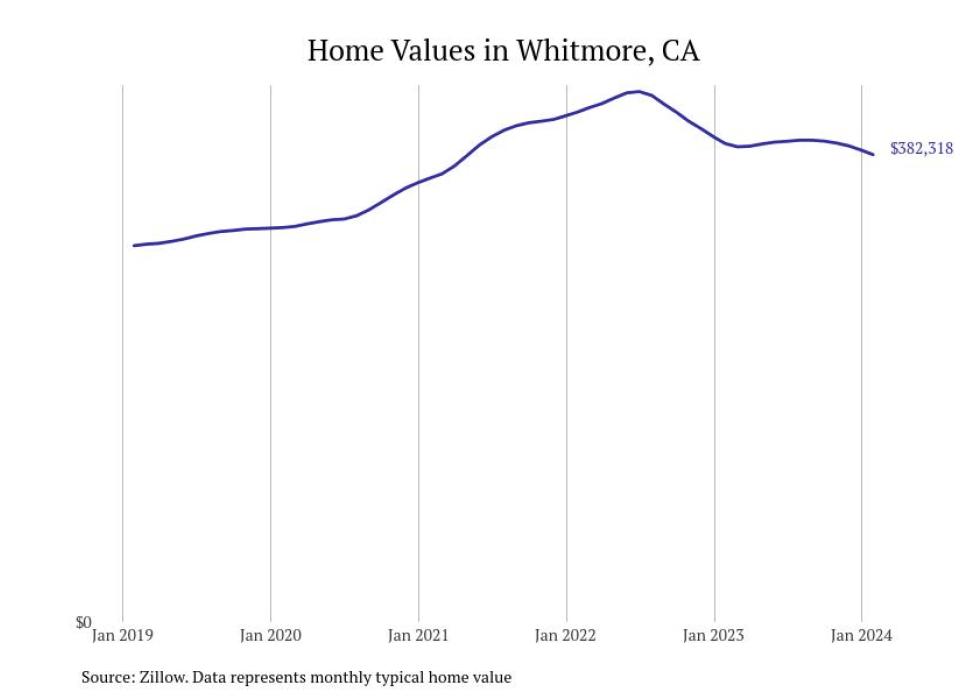
#16. Whitmore, CA
- 5-year price change: +$74,414 (+24.2%)
- Typical home value: $382,318 (#4 most expensive city in metro)
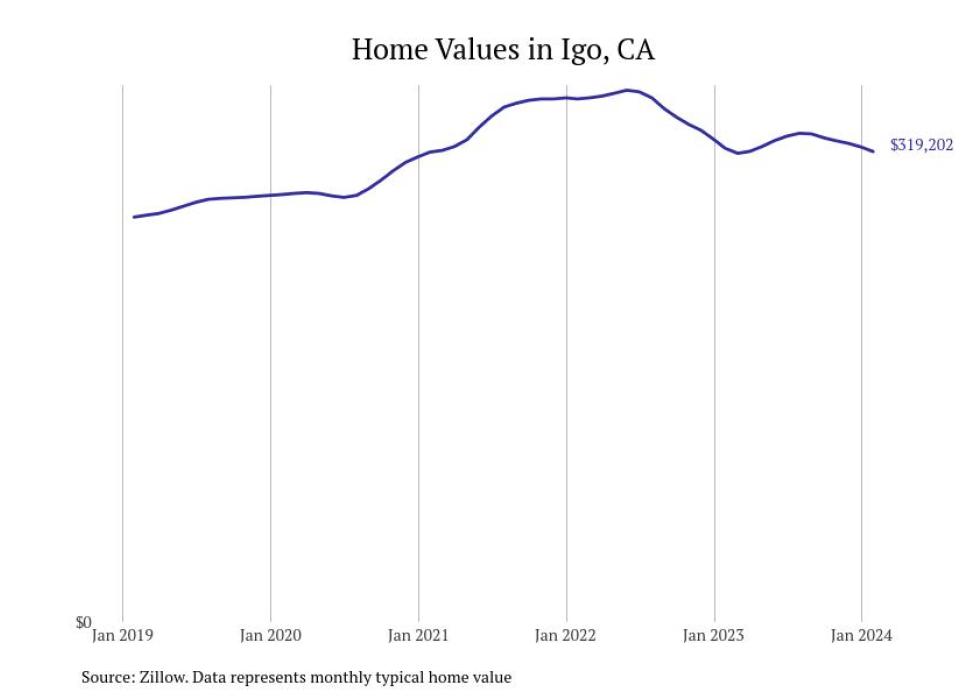
#15. Igo, CA
- 5-year price change: +$44,450 (+16.2%)
- Typical home value: $319,202 (#10 most expensive city in metro)
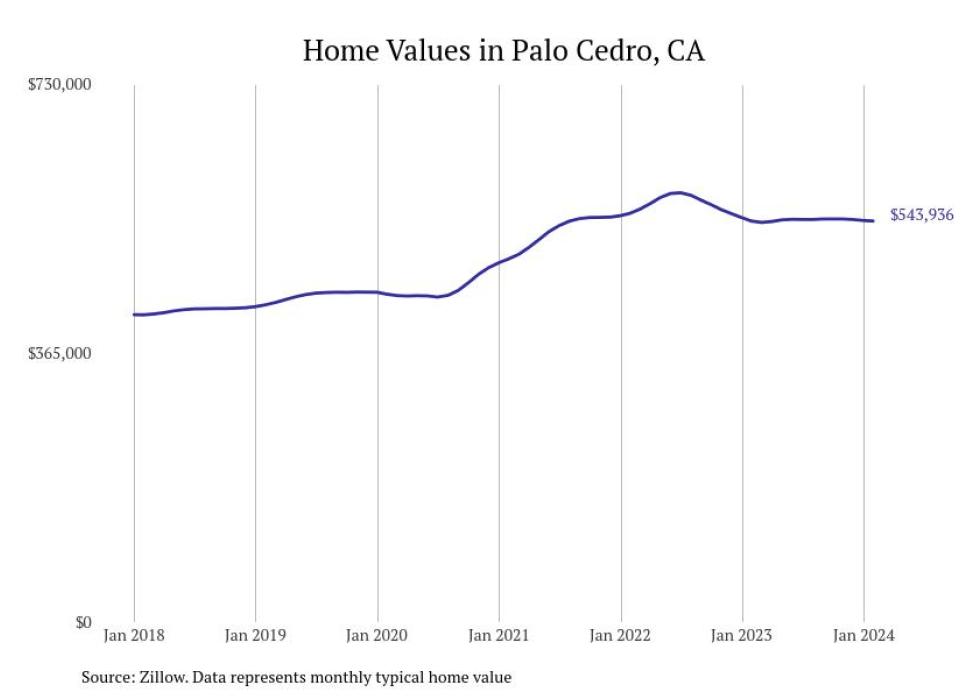
#14. Palo Cedro, CA
- 5-year price change: +$113,772 (+26.4%)
- Typical home value: $543,936 (#1 most expensive city in metro)
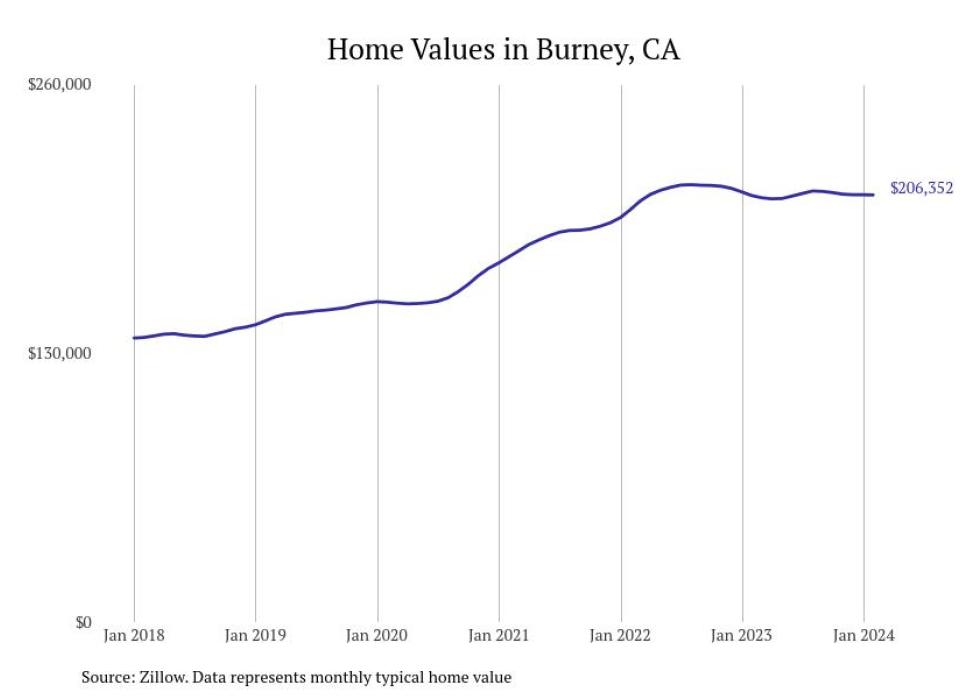
#13. Burney, CA
- 5-year price change: +$60,942 (+41.9%)
- Typical home value: $206,352 (#17 most expensive city in metro)
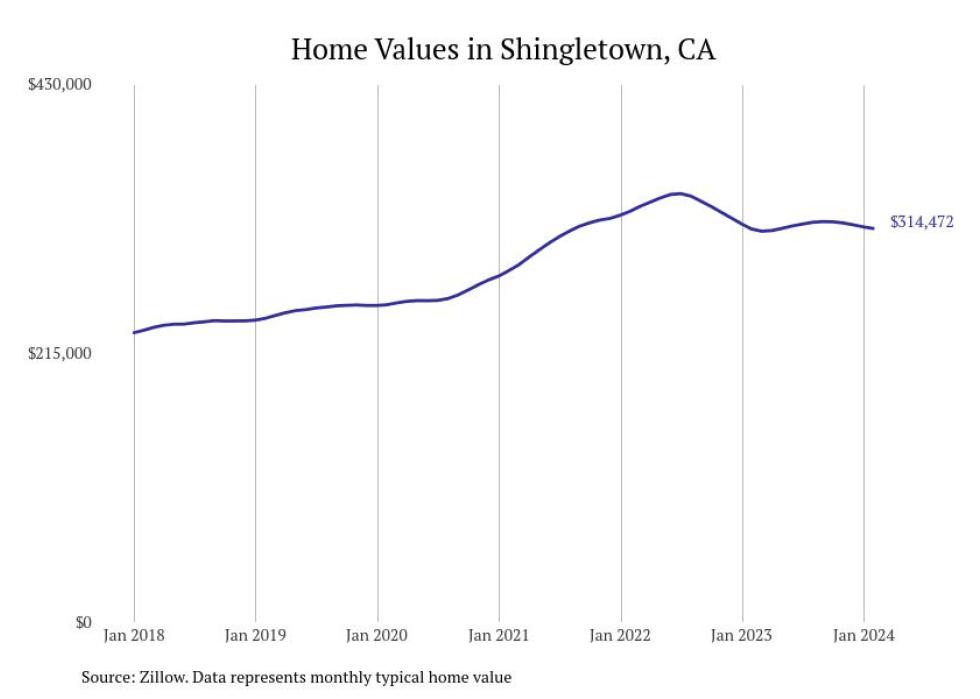
#12. Shingletown, CA
- 5-year price change: +$71,850 (+29.6%)
- Typical home value: $314,472 (#11 most expensive city in metro)
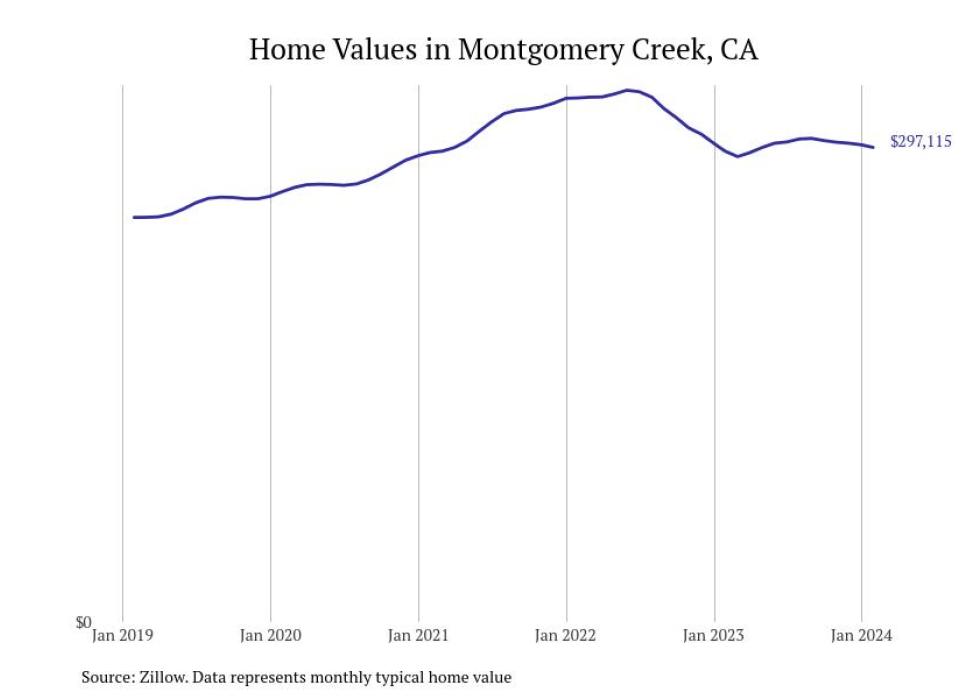
#11. Montgomery Creek, CA
- 5-year price change: +$43,816 (+17.3%)
- Typical home value: $297,115 (#13 most expensive city in metro)
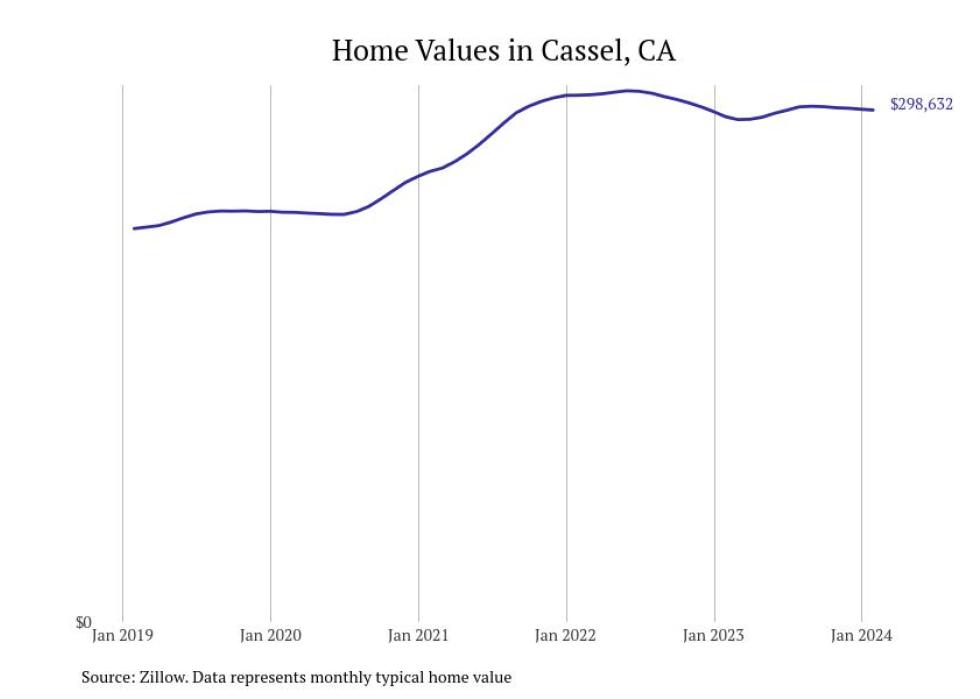
#10. Cassel, CA
- 5-year price change: +$69,164 (+30.1%)
- Typical home value: $298,632 (#12 most expensive city in metro)
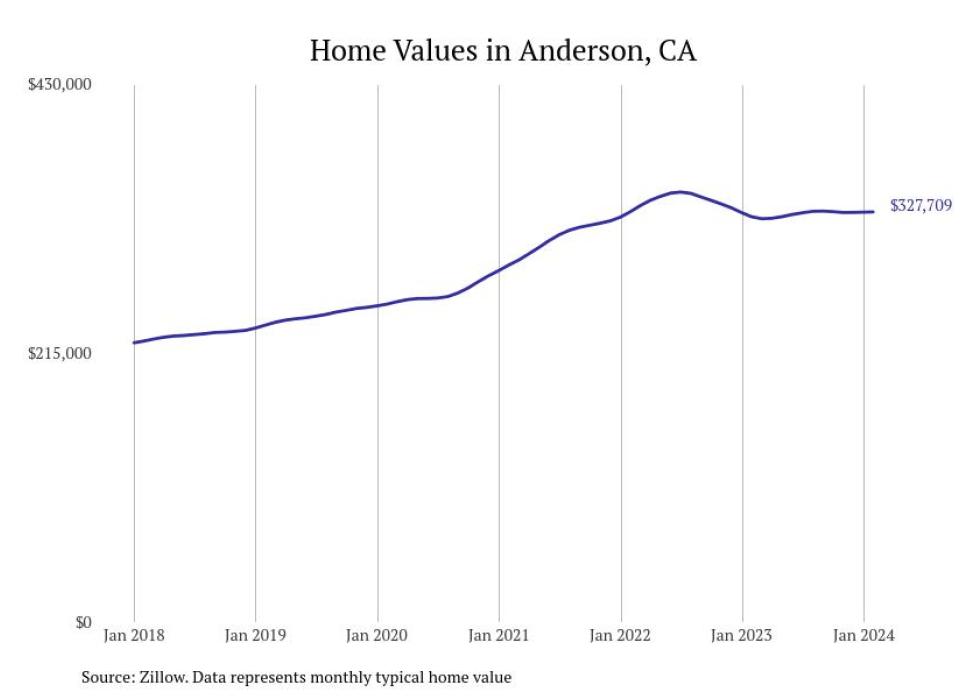
#9. Anderson, CA
- 5-year price change: +$90,550 (+38.2%)
- Typical home value: $327,709 (#9 most expensive city in metro)
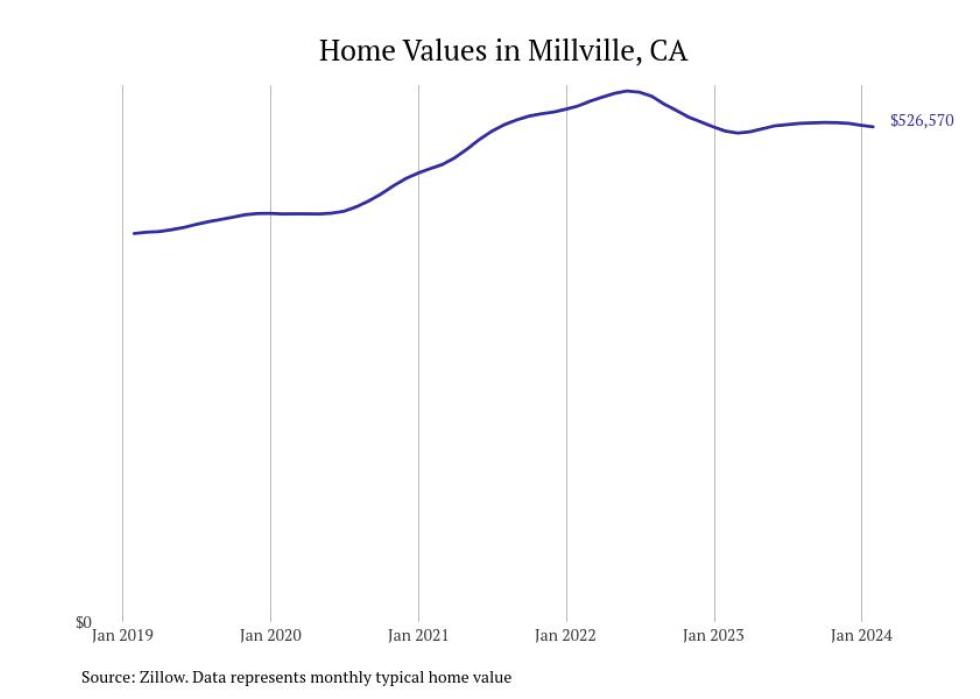
#8. Millville, CA
- 5-year price change: +$113,433 (+27.5%)
- Typical home value: $526,570 (#2 most expensive city in metro)
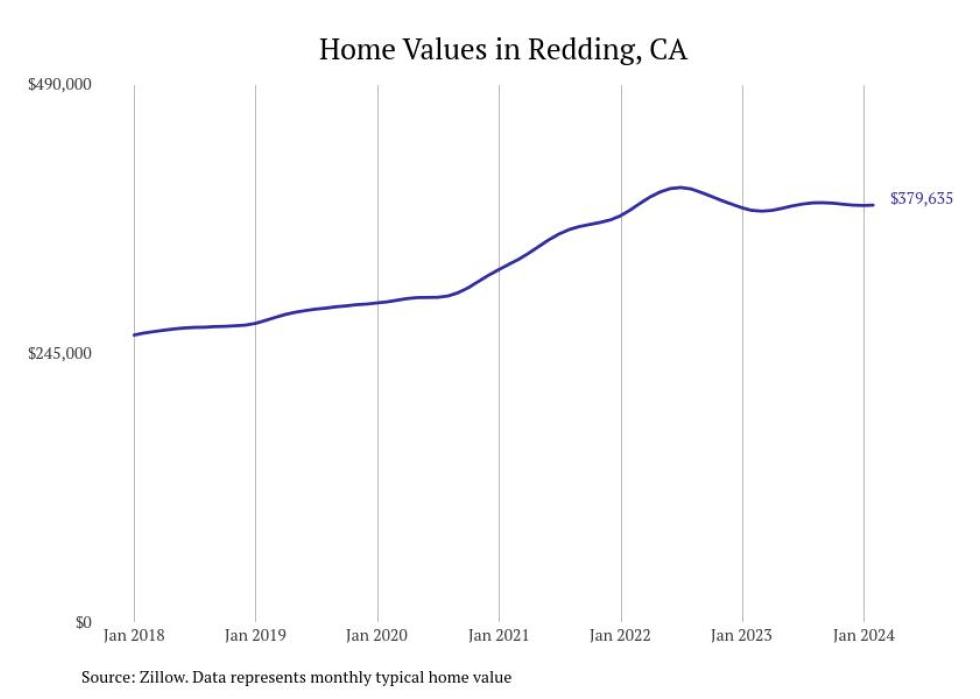
#7. Redding, CA
- 5-year price change: +$105,177 (+38.3%)
- Typical home value: $379,635 (#5 most expensive city in metro)
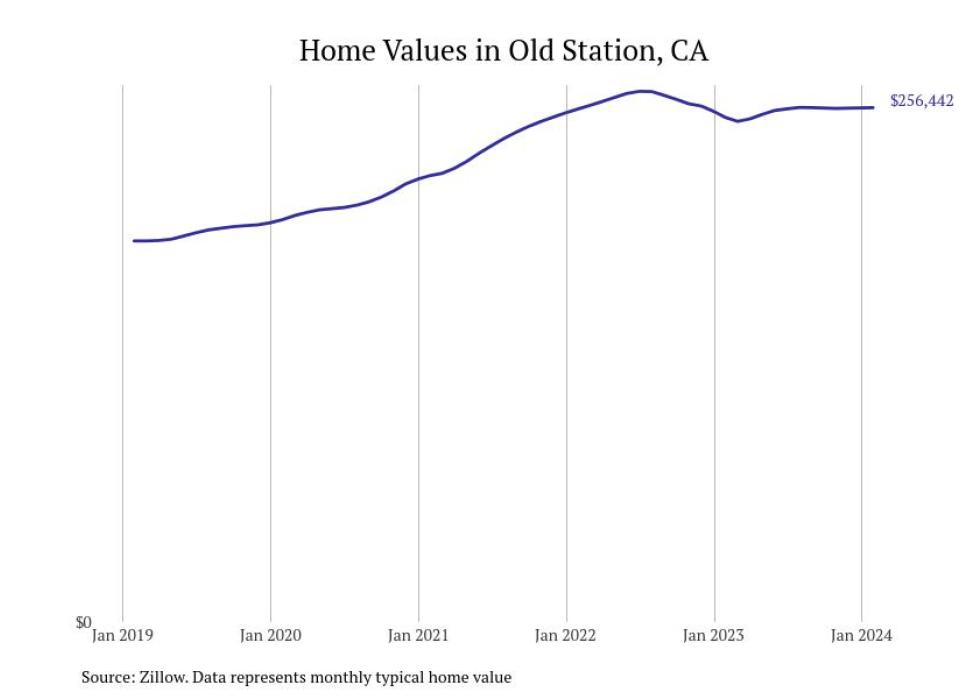
#6. Old Station, CA
- 5-year price change: +$66,424 (+35.0%)
- Typical home value: $256,442 (#16 most expensive city in metro)
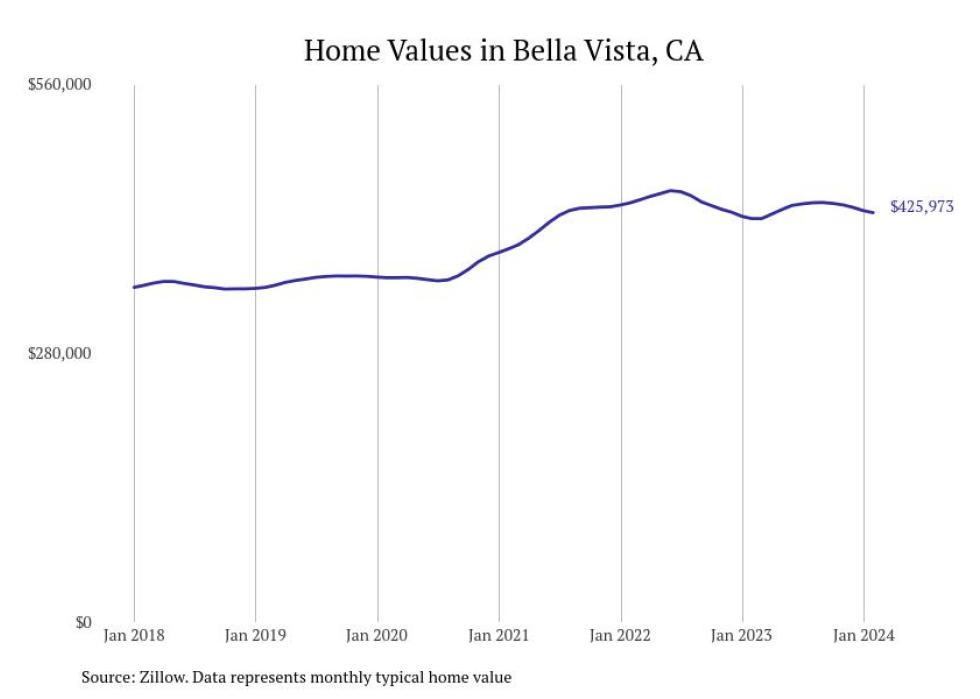
#5. Bella Vista, CA
- 5-year price change: +$77,763 (+22.3%)
- Typical home value: $425,973 (#3 most expensive city in metro)
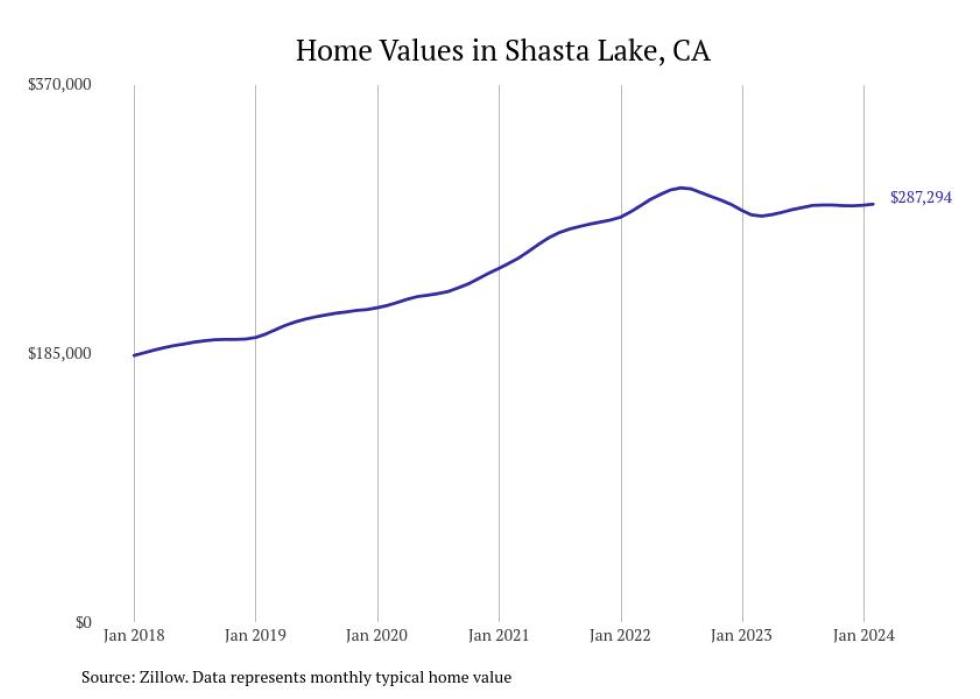
#4. Shasta Lake, CA
- 5-year price change: +$89,525 (+45.3%)
- Typical home value: $287,294 (#14 most expensive city in metro)
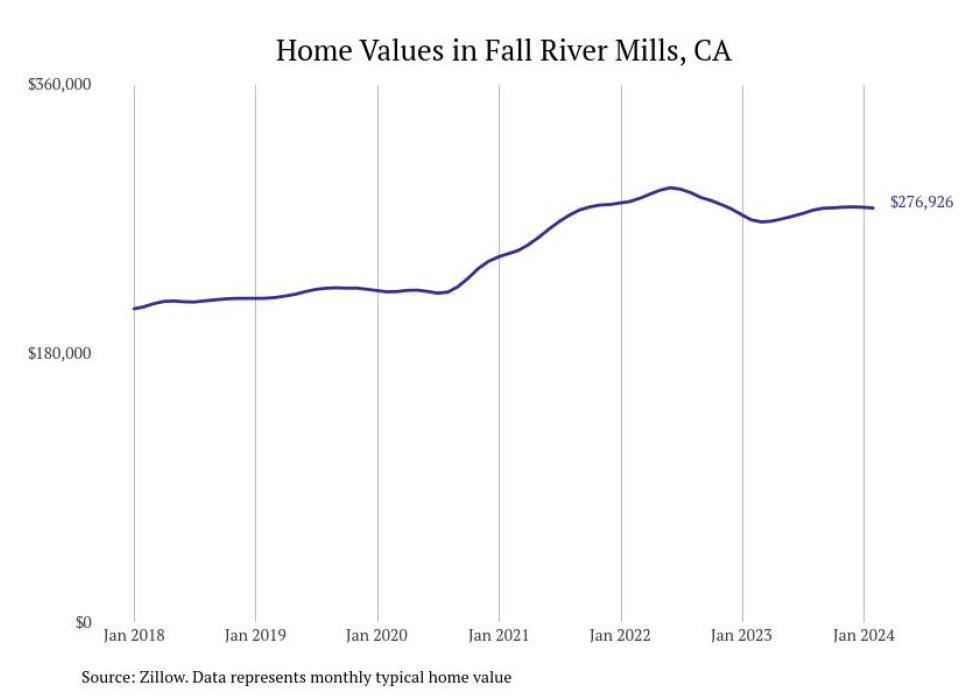
#3. Fall River Mills, CA
- 5-year price change: +$60,362 (+27.9%)
- Typical home value: $276,926 (#15 most expensive city in metro)
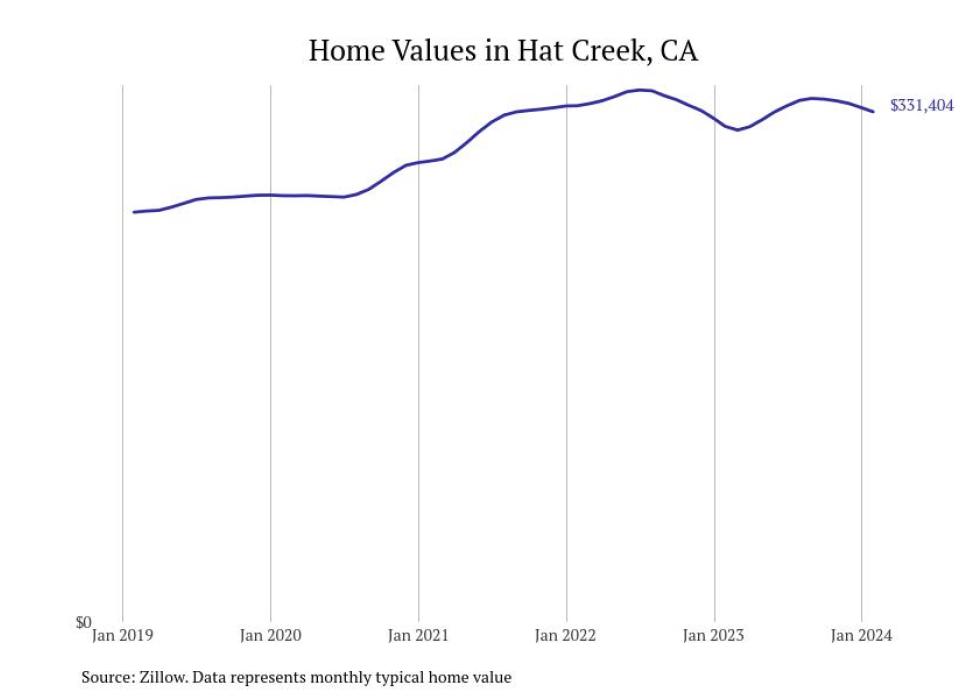
#2. Hat Creek, CA
- 5-year price change: +$65,225 (+24.5%)
- Typical home value: $331,404 (#8 most expensive city in metro)
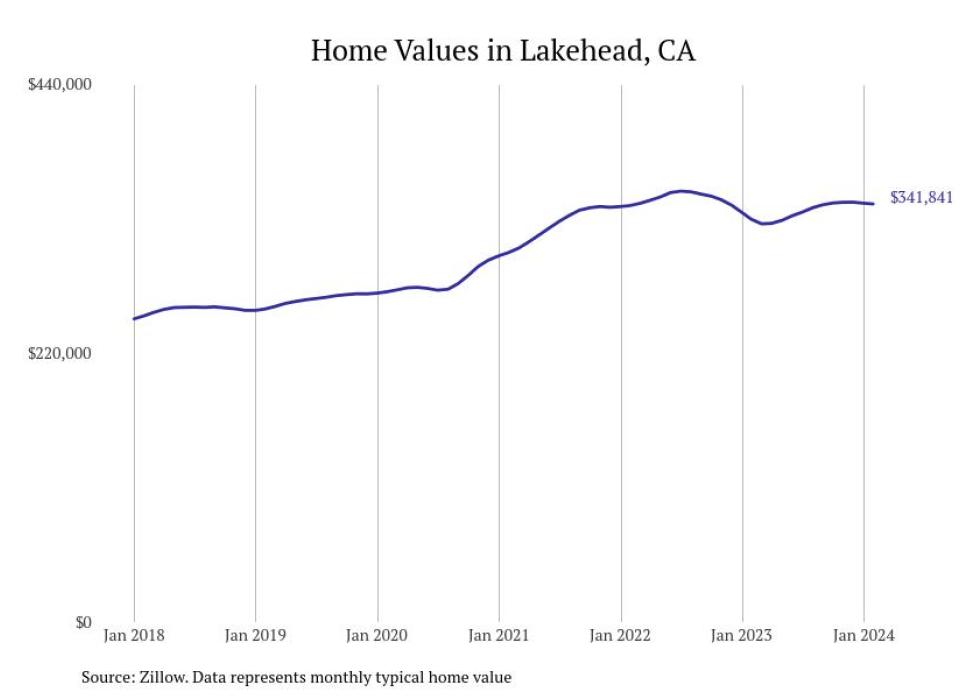
#1. Lakehead, CA
- 5-year price change: +$85,885 (+33.6%)
- Typical home value: $341,841 (#7 most expensive city in metro)
This story features data reporting and writing by Elena Cox and is part of a series utilizing data automation across 380 metros.


